
Nearly all NCAA Division I development teams utilize tiered reward systems with donors. Tiered reward systems determine gift value levels, then offer donors better rewards as they increase their giving level. Ultimately, the goal of any tiered reward system is to incentivize those at lower levels to take action in order to move to a higher level and acquire greater benefits. An airline, for example, hopes their frequent flier tiered reward system incentivizes travelers to consistently book with their airline (rather than shop around), due to the allure of free flights or better seat upgrades.
Past research suggests (Harbaugh, 1998; McCall & Voorhees, 2010) when donors give to programs with tiered reward systems, the large majority give only enough to put them into the desired tier. For example, if an athletics department requires a gift of between $500 and $1,499 to qualify for a tier which includes the ability to buy four football season tickets, the large majority of donors are going to give $500 to $600. Almost no donor is going to give $1,450; instead, that donor is more likely going to give $1,500 and move into the next tier, which (presumably) includes better benefits.
Because we understand this about consumer behavior, it is important for development staffs to strategically design their tiered reward systems, begging the question: How are the number of tiers or the minimum gifts required to join those tiers established? And more importantly, what would be the impact on donor behavior if those levels were manipulated? A few years ago, one of our Sport Administration graduate students here at the University of North Carolina, Javonte Lipsey, asked those very questions. Unable to find a great answer, Javonte turned his questions into a graduate thesis project, the results of which we would like to share.
Uncovering the optimal number of reward tiers and price points for each of those tiers is not a simple question to answer. For example, some research related to online crowdfunding campaigns suggests utilizing fewer reward tiers is linked to greater goal achievement, (Chen et al., 2016) while other studies suggest online fundraising is more likely to hit a financial goal with more reward tiers (Sattler et al., 2019). Analyzing college athletics fundraising is complicated by the mediating effect of athletic success on donor giving. As just about anyone who works or follows college athletics understands, departments with successful football and men’s basketball programs (or the programs which draw the largest crowds for football), lead the way in donor giving (Humphreys & Mondello, 2007; Stinson & Howard, 2004). For example, according to the College Athletics Financial Information (CAFI) Database provided by the Knight Commission, the top 10 schools for donor contributions in 2019 were:
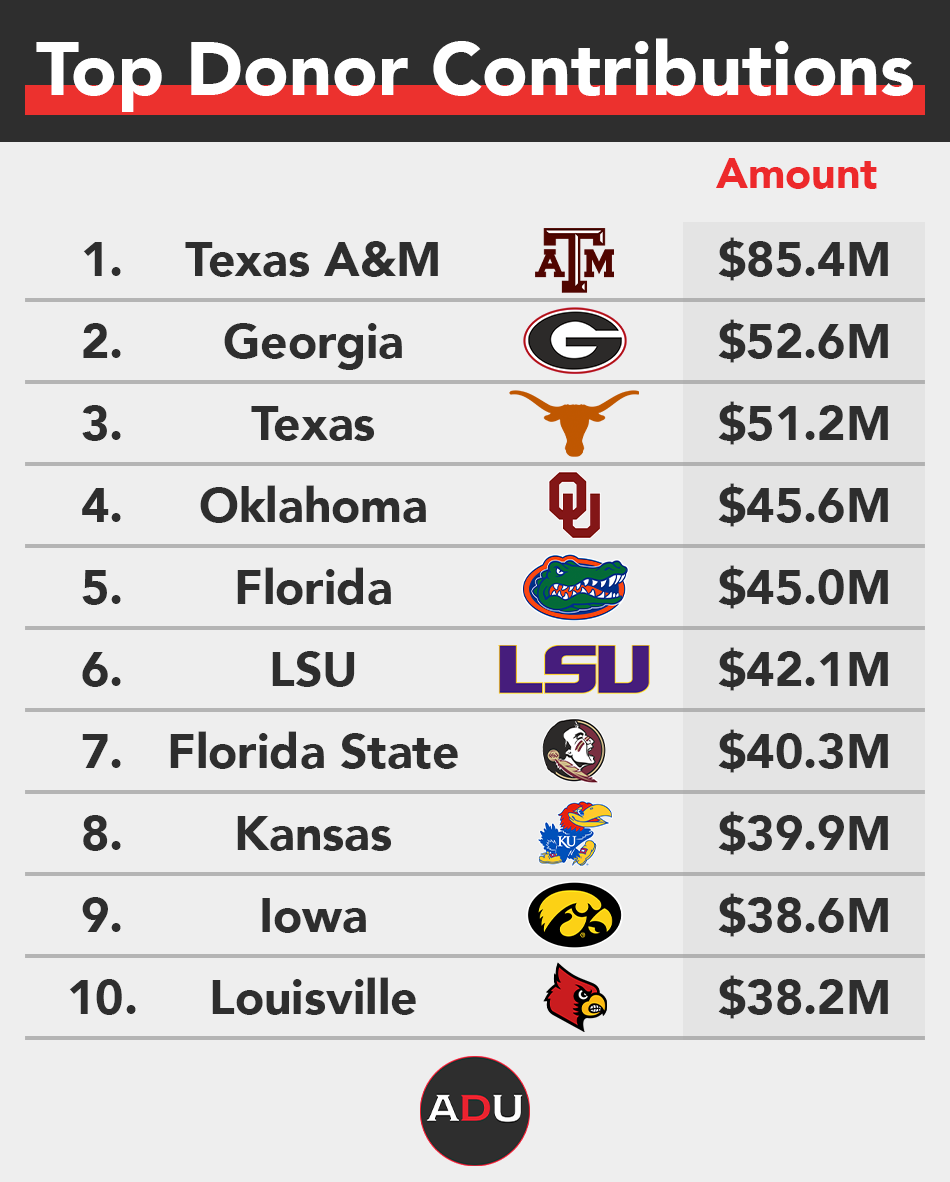
Many of these schools have a history of success in football and play their games in some of the largest football stadiums in college sports. But when Javonte examined the number of reward tiers for 121 FBS schools, he found something a little unexpected. Football or basketball success was not correlated with the number of reward tiers established by the development team. Similarly, there was also no relationship between the total value of annual donations and the total number of reward tiers. In other words, schools which have a lot of success (either athletically or in fundraising) are just as likely to have five reward tiers as they are to have 12 reward tiers. The same is true for schools which have not had much success. If the number of reward tiers were developed strategically, one would guess a pattern would emerge. That was not the case. In fact, when examining the average number of reward tiers among all the schools in his sample, the mean number of tiers was 8.8, with nearly 60% of schools offering either 8, 9, or 10 giving levels. Schools in the lowest quartile of total annual donation value had an average of 8.5 tiers. Schools in the highest quartile of total annual donation value had an average of 8.3 tiers. We are still not sure why 8 to 10 tiers seem to be the number of reward levels most schools offer. Our guess is that many institutions have not analyzed the impact of establishing different tiers on revenue. Instead, many likely opt to either imitate what other athletics departments are doing or they continue doing what has already been established at their school. If this is the case, in an age where sport organizations are now using advanced analytics and predictive modeling in a variety of capacities, it is likely an inefficient approach.
After Javonte’s initial foray investigating fundraising reward tiers, a second graduate student of ours, Sarah Watson, took another stab at defining best practices in developing a tiered reward system. Sarah read Javonte’s paper and noticed football and basketball success did seem to predict one thing: the mean minimum gift amount among all reward tiers. While interesting, this relationship didn’t really tell us much because the mean minimum gift amount for all tiers was a poor practical metric. A school with five tiers and a school with 12 tiers might have the same mean minimum gift amount because it was calculated by simply adding up the minimum gift at each tier and dividing it by the total number of tiers. (For example, if a school had five tiers and the minimum gift for each tier was $100, $300, $500, $1000, and $5000, the mean minimum gift = $6,900 divided by 5 or $1,380.) After thinking about this, Sarah came to the conclusion a better way to measure might be to use the minimum gift amount required to join the highest tier available. Regardless of whether a program offered five tiers or 15 tiers, all schools have a top tier. In addition, the minimum gift required to join the top level varied considerably, which is a good thing when it comes to developing predictive regression models. Among the 112 FBS schools in her dataset, the average minimum gift required to join the top donation level was $35,818, but one school in her dataset required a gift of $250 to join the top tier and another school required $100,000. With such a range, we felt confident Sarah would see a relationship between the minimum gift required at this highest tier and the total amount raised. It seems logical that the more schools charged to join their top donor level, the more likely they would be to generate the most money.
We were wrong.
Sarah’s models revealed no statistically significant relationship between total development revenue generated and the minimum gift requirement to join the top tier. Highly successful fundraisers are just as likely to charge $5,000 to join their top reward tier as they are to charge $50,000. Her results, seen in conjunction with Javonte’s, support the notion that the manner in which tiered reward levels within FBS athletics departments are established is suboptimal and likely not maximizing revenue.
Another intriguing finding from Sarah’s work was the factors which did predict the minimum gift requirement for the top reward tier. This amount seemed to be influenced by the prior season’s football attendance, all-time men’s basketball winning percentage, and household income in the region; all logical conclusions. Schools which draw a lot of football fans or have a historically successful men’s basketball program establish a higher price point at their top giving level. They also set higher prices in parts of the country where income is highest. But Sarah also had variables in her model which were nonsignificant, such as Director’s Cup standings or the number of athletics department Twitter followers. One would think such variables, which should serve as a proxy for overall athletic prowess or general popularity, should predict how much an athletic department is charging to join their elite donor level. Sarah found that not to be the case.
If the current system is not operating at maximum proficiency, as this evidence suggests, what can be done? We hope our results would lead to more discussions within athletics departments about how they have structured their system. But it also probably leaves many athletics administrators asking “So what is the optimal structure? How many tiers should we have? What should we be charging at each level?” These are excellent and logical questions. Currently, we don’t have the perfect formula to provide that answer.
But we have a start.
Last year, a third graduate student of ours, Ashley Kavanagh, suggested she was interested in looking at issues related to development. After hearing about Javonte’s and Sarah’s projects, Ashley decided she wanted to move their research line forward. She figured while schools have many different reward tiers and various price points, they all have one thing in common; an entry level. So she asked what impact would a change in price have on total number of donors and total revenue generated at the lowest tier level. To solve this specific riddle, she requested all NCAA Division I development teams to share one simple piece of data; the number of donors at their lowest giving level. Ultimately, 129 schools provided the information. Once she obtained that number from the schools, she then collected all the attributes she could think of which might impact how many people donate, such as football and men’s basketball success, Director’s Cup standings, conference affiliation, school enrollment, tuition costs, and other factors. In addition to these variables, she added two other key metrics: (a) the minimum gift requirement needed to join the lowest tier of the development program and (b) the total number of people working in development at a particular school. Among the schools in the dataset, the average number of donors at the lowest giving tier averaged 1,124. The minimum gift requirement necessary to join this tier ranged from $1 to $1,500, with a mean of $94.19 (of note, 64% of schools set this minimum gift requirement at one of two price points, either $50 or $100). Development staff ranged from 1 to 44, with a mean of 8.
Ashley’s model explained more than 73% of the variance in total number of donors at the lowest reward tier, which is considered a highly predictive model. Perhaps most impressive, however, was that after controlling for factors like athletic success and conference affiliation (which allowed her to compare Alabama to Akron), the total number of development staff and the donation amount required to join the lowest tier still explained more than 20% of the variance in total number of donors, which was a terrific statistical outcome. The results from her model suggest for every additional development employee hired, athletics departments would see an additional 99 donors at the lowest giving tier (additional staff are likely to increase the number of donors at higher levels as well, but Ashley was not able to test for that with this model). And for every $1 increase in the minimum cost to join a development program, an athletics department is likely to see four fewer donors at the lowest tier. In other words, a school with 3,000 donors giving the minimum gift of $100 to join the program hypothetically generates $300,000 at the bottom tier. If this same school increased the minimum gift to $150, they would likely lose 200 donors, but would generate $420,000, a 40% increase in revenue. At a school with far fewer donors, the opposite is likely to occur. For example, if a school has 300 donors and a minimum gift requirement of $150, they hypothetically generate $45,000 at this level. Raising the gift level to $175 would likely cost them 100 donors and bring total giving down to $35,000 but lowering the minimum gift requirement to $100 is likely to add 200 donors, which would generate $50,000 (and nearly double the number of donors now in the lowest tier).
Predictive models like the ones utilized in these three graduate theses are not perfect. The greater number of variables included, the stronger the validity and reliability. But what these models clearly illustrate is the need for greater analytical rationale behind the development of the tiered reward models used in college athletics fundraising. We have already seen the secondary ticket market clearly demonstrate a need for better ticket pricing strategies in college athletics, something many departments are beginning to embrace. The same should be said regarding the continued need to apply analytics to development. Data should be driving, or at least guiding, the decision-making process if administrators want to maximize revenue during this pivotal time for college athletics.
Nels Popp is currently an Associate Professor for Sport Administration at University of North Carolina at Chapel Hill (nelspopp@email.unc.edu)
Javonte Lipsey is currently a doctoral student at the Ohio State University.
Sarah Watson currently works for the Rams Club, the development arm for UNC Athletics.
Ashley Kavanagh currently works for LEARFIELD at its Rutgers property.