
In an era when many states are actively choosing to reduce their support for higher education, cash is king.
From selling their own parking lots to outsourcing bookstore operations, public universities have been forced to get creative in order to generate much-needed funding to support continued operations.
From the athletic department perspective, while a handful of programs generate enough revenue to allocate surplus funds to the university at large (link), the vast majority are scrambling for ways to generate additional income to cover rising coach and administrator salaries, renovation and construction costs, and the myriad of other expenses incurred in the daily operation of a Division I athletic department.
The inaugural Intercollegiate Apparel Agreement Report from the Center for Research Intercollegiate Athletics (CRIA) at the University of North Carolina at Chapel Hill provides a detailed look into some trends regarding the revenue received from public Football Bowl Subdivision (FBS) institutions from apparel, licensing, and sponsorship agreements with Adidas, Nike, Russell Athletic, and Under Armour.
We thought it also might be interesting to take a deeper dive into the amounts of cash allocated as part of these agreements, including which institutions are receiving the most (as a percentage of the overall agreement), how the amount of cash allocated has evolved over the past five years, and which brands are allocating the largest percentage of their agreements in cash.
Table 1 includes a rundown of the amount of cash allocated during the 2017-18 academic year in each of the agreements included in CRIA’s database, ranked by the percentage of cash included. Of note is the fact that of the 85 agreements, 37 do not include any cash allocation whatsoever. Several Power Five institutions are included in this group, including Illinois, Florida, Minnesota, and Arizona.
The average amount of cash provided during the 2017-18 academic year to members of Power Five conferences was $1.3 million, or 30.8% of the total value of the agreements. For Group of Five institutions, the cash totals averaged only $86,500 (just 10.7% of the total). In fact, only eight of the 40 agreements with Group of Five institutions in the database include cash, led by the $1.42 million received by Connecticut.
However, a few of the largest agreements signed over the past two years include a considerable amount of cash, most notably Nike’s new agreements with Texas and Michigan, and Under Armour’s agreements with UCLA and Wisconsin. Though we do not include it in our year-over-year totals, Ohio State also received a $20 million “signing bonus” from Nike last year.
Which universities may be in line for similar paydays over the next year or two? Agreements between several large athletic departments and Nike are scheduled to end at the conclusion of the academic year next June, including North Carolina, Alabama, Oregon, UConn, Iowa, and Iowa State. Nebraska and Georgia Tech have already announced new agreements with Adidas. The agreement between Adidas and the University of Kansas and Nike’s with Mississippi, Washington, and Boise State end in 2019.
If history is any indication, institutions affiliated with Nike and Under Armour may be in for a larger payday. Figure 1 displays the trend in total cash allocations by each brand for the period of 2012-13 through the 2017-18 academic year.
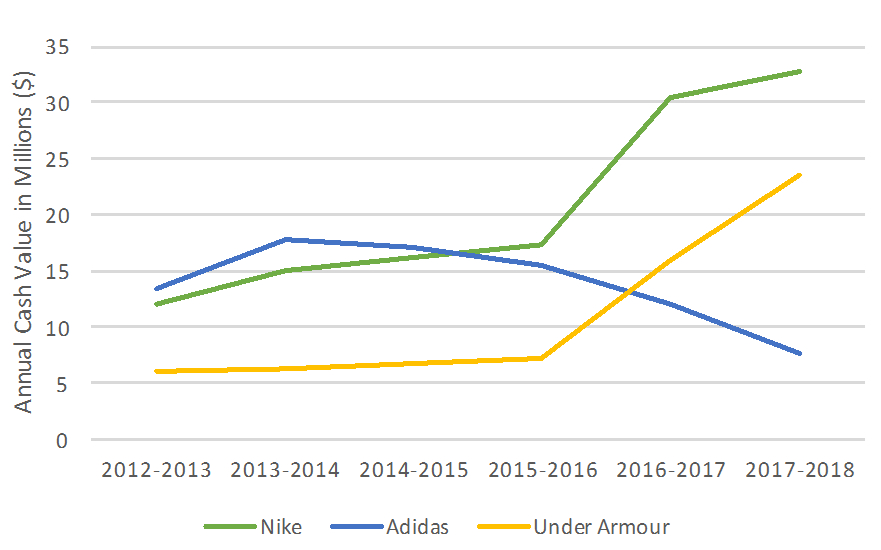
Figure 1. Total amount of cash allocated by Adidas, Nike, and Under Armour since 2012-13
The figure displays a spike in cash allocated by both Nike and Under Armour since the 2015-16 academic year, attributable to the aforementioned new agreements with Texas, Michigan, Ohio State, UCLA, Wisconsin, and South Carolina. However, as evidenced by Figure 2, this trend is belied by the fact that across all of the agreements Nike has been the brand least likely to include a large percentage of cash, with the exception of elite programs such as Michigan, Ohio State, and Texas. It has been Adidas and Under Armour, in their quest to challenge Nike’s category dominance, which have been increasingly willing to provide institutions with a larger percentage of cash in the agreements.
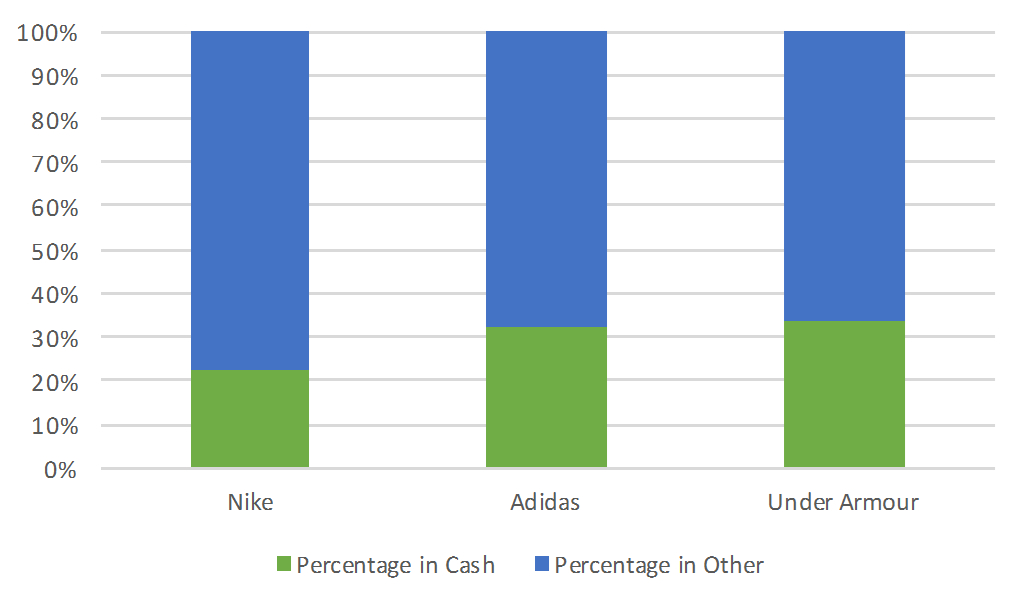
Figure 2. % of cash allocated by Adidas, Nike, and Under Armour in apparel
When surveying this landscape, it is also important to consider challenges facing the apparel industry, including issues related to the current retail environment. In addition, now that Under Armour has successfully expanded their reach across the Midwest (with Notre Dame and Wisconsin), Southeast (Auburn and South Carolina), and West (UCLA and Cal-Berkeley), and taking into consideration its recent sales and stock slumps, it would not be surprising to see the brand pull back in this area and take a seat on the sidelines over the next couple of renewal cycles. With Under Armour’s impending on-field apparel agreement with Major League Baseball, it may also choose to re-focus in other areas of its business over the upcoming years.
On the other hand, given the influx of investment to support its marketing efforts in North America from its German headquarters and recent sales upswing, Adidas may be well-positioned to use the potential for large cash payments to pluck a handful of top programs from Nike over the next several years. The brand, which has traditionally targeted institutions that can help it make a splash in larger urban markets such as Houston, Kansas City, Louisville, Miami, and Phoenix, recently picked off Georgia Tech, an affiliation that will be utilized to supplement its digital and social media marketing efforts in the Atlanta market.
Regardless of whether these statements turn out to be prescient, institutions would be wise to leverage the level of competition between these brands and within the retail business environment to maximize cash allocations in future apparel agreements.
Jonathan A. Jensen, Ph.D. serves as an Assistant Professor at the University of North Carolina at Chapel Hill. Tyler Wisniewski is an undergraduate student in the university’s Sport Administration program.
Table 1. Percentage of cash allocated during 2017-18 academic year in FBS athletic apparel agreements
| University | Conference | Cash | % of Total | Brand |
| Texas | Big 12 | $9,000,000 | 75.3% | Nike |
| UCLA | Pac-12 | $9,000,000 | 54.5% | Under Armour |
| Michigan | Big Ten | $4,820,000 | 49.0% | Nike |
| Kentucky | SEC | $1,800,000 | 48.3% | Nike |
| NC State | ACC | $1,950,000 | 46.99% | Adidas |
| Wisconsin | Big Ten | $4,250,000 | 46.4% | Under Armour |
| South Carolina | SEC | $2,600,000 | 38.8% | Under Armour |
| Georgia Tech | ACC | $950,000 | 38.0% | Russell Athletic |
| Maryland | Big Ten | $1,675,000 | 35.8% | Under Armour |
| Auburn | SEC | $2,200,000 | 34.4% | Under Armour |
| Florida State | ACC | $1,400,000 | 33.3% | Nike |
| Connecticut | AAC | $1,425,000 | 31.5% | Nike |
| Texas Tech | Big 12 | $800,000 | 30.2% | Under Armour |
| Texas A&M | SEC | $1,850,000 | 27.2% | Adidas |
| Oklahoma | Big 12 | $1,400,000 | 26.7% | Nike |
| Kansas | Big 12 | $1,775,000 | 26.6% | Adidas |
| Colorado | Pac-12 | $750,000 | 26.3% | Nike |
| Tennessee | SEC | $1,000,000 | 25.6% | Nike |
| Georgia | SEC | $1,000,000 | 25.6% | Nike |
| Indiana | Big Ten | $1,425,000 | 25.1% | Adidas |
| Cincinnati | AAC | $1,165,000 | 24.5% | Under Armour |
| Washington | Pac-12 | $925,000 | 24.1% | Nike |
| Nebraska | Big Ten | $1,000,000 | 23.9% | Adidas |
| Ohio State | Big Ten | $1,488,000 | 23.6% | Nike |
| LSU | SEC | $1,000,000 | 23.3% | Nike |
| South Florida | AAC | $725,000 | 22.8% | Under Armour |
| West Virginia | Big 12 | $750,000 | 22.4% | Nike |
| Michigan State | Big Ten | $900,000 | 22.2% | Nike |
| Oregon | Pac-12 | $610,000 | 21.7% | Nike |
| Louisville | ACC | $1,555,000 | 21.3% | Adidas |
| Alabama | SEC | $780,000 | 20.1% | Nike |
| Iowa | Big Ten | $350,000 | 17.9% | Nike |
| Purdue | Big Ten | $350,000 | 17.1% | Nike |
| Oklahoma State | Big 12 | $750,000 | 16.3% | Nike |
| Virginia | ACC | $500,000 | 16.3% | Nike |
| Virginia Tech | ACC | $275,000 | 14.5% | Nike |
| North Carolina | ACC | $475,000 | 12.3% | Nike |
| Washington State | Pac-12 | $200,000 | 9.1% | Nike |
| Oregon State | Pac-12 | $225,000 | 7.4% | Nike |
| Rutgers | Big Ten | $100,000 | 5.7% | Nike |
| Missouri | SEC | $150,000 | 4.8% | Nike |
| UAB | C-USA | $50,000 | 4.5% | Under Armour |
| Fresno State | MWC | $25,000 | 4.3% | Nike |
| Clemson | ACC | $115,000 | 4.1% | Nike |
| Boise State | MWC | $50,000 | 3.9% | Nike |
| MTSU | C-USA | $5,000 | 3.5% | Nike |
| Iowa State | Big 12 | $15,000 | 3.1% | Nike |
| UNLV | MWC | $15,000 | 1.5% | Nike |
| Illinois | Big Ten | None | N/A | Nike |
| Florida | SEC | None | N/A | Nike |
| Minnesota | Big Ten | None | N/A | Nike |
| Arizona | Pac-12 | None | N/A | Nike |
| Mississippi | SEC | None | N/A | Nike |
| Hawaii | Big West | None | N/A | Under Armour |
| Memphis | AAC | None | N/A | Nike |
| East Carolina | AAC | None | N/A | Adidas |
| Houston | AAC | None | N/A | Nike |
| New Mexico | MWC | None | N/A | Nike |
| San Jose State | MWC | None | N/A | Adidas |
| Ohio University | MAC | None | N/A | Adidas |
| Arkansas State | Sun Belt | None | N/A | Adidas |
| Western Kentucky | C-USA | None | N/A | Russell Athletic |
| Louisiana Tech | C-USA | None | N/A | Adidas |
| Nevada | MWC | None | N/A | Nike |
| Utah State | MWC | None | N/A | Nike |
| FIU | C-USA | None | N/A | Adidas |
| Kent State | MAC | None | N/A | Under Armour |
| New Mexico State | WAC | None | N/A | Under Armour |
| Old Dominion | C-USA | None | N/A | Under Armour |
| FAU | C-USA | None | N/A | Adidas |
| UTSA | C-USA | None | N/A | Adidas |
| Miami (OH) | MAC | None | N/A | Adidas |
| Marshall | C-USA | None | N/A | Nike |
| Western Michigan | MAC | None | N/A | Adidas |
| Appalachian State | Sun Belt | None | N/A | Nike |
| Northern Illinois | MAC | None | N/A | Adidas |
| Eastern Michigan | MAC | None | N/A | Adidas |
| Central Michigan | MAC | None | N/A | Adidas |
| Bowling Green | MAC | None | N/A | Nike |
| Ball State | MAC | None | N/A | Nike |
| Akron | MAC | None | N/A | Adidas |
| Idaho | Sun Belt | None | N/A | Nike |
| Texas State | Sun Belt | None | N/A | Adidas |
| South Alabama | Sun Belt | None | N/A | Nike |
| Louisiana-Monroe | Sun Belt | None | N/A | Adidas |