
This time last year, college basketball fans across the country were making plans to enjoy the NCAA men’s basketball tournament. Whether those plans included watching games with friends and family, filling out brackets or watching games online while pretending to work, all of the excitement quickly dissolved when the tournament was cancelled due to the worsening COVID-19 pandemic. Now, as we again plan for the tournament, maybe a little differently this year, the excitement and anticipation is even greater. Undoubtedly there is pent up demand from both avid and casual fans for buzzer beaters, upsets and Cinderella stories.
So, as our industry embarks on one of its most popular events of the year, Navigate wants to wish everyone a happy and healthy March Madness. Now, on to the data!
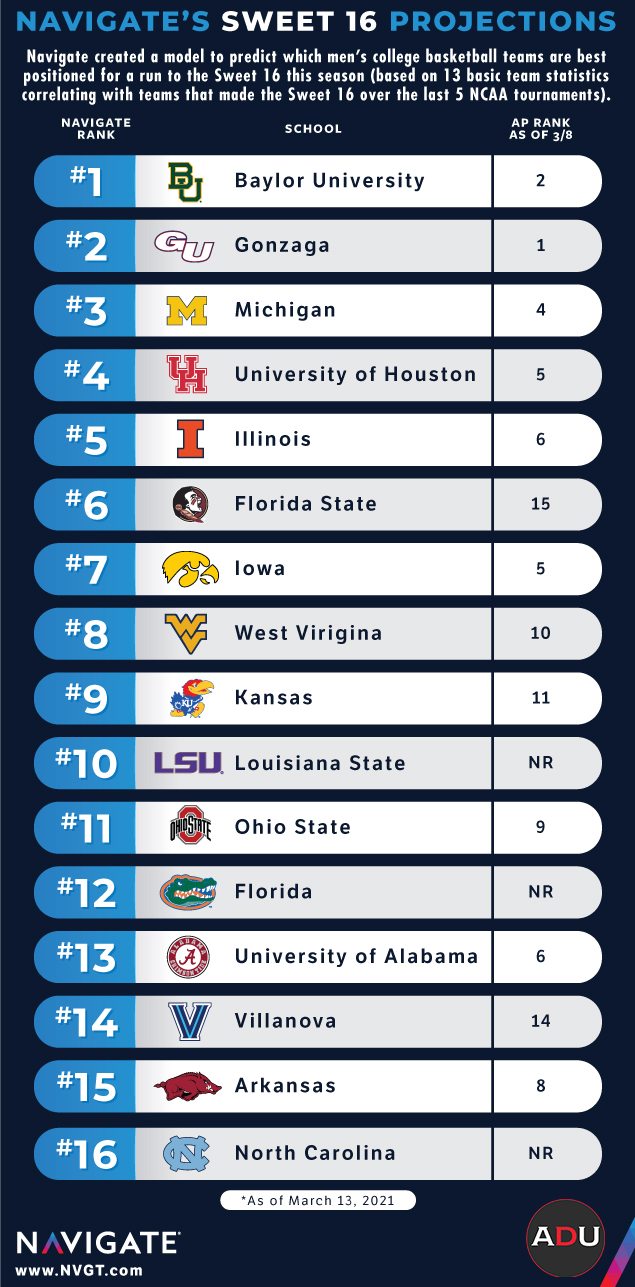
Given we are a data-driven consulting firm in sports and entertainment, Navigate decided to create a model to predict which men’s college basketball teams are best positioned for a run to the Sweet 16 this season (based on 13 basic team statistics correlating with teams that made the Sweet 16 over the last 5 NCAA tournaments).
Disclaimers
- Model only considers games played through 3/1, so Navigate is not predicting outcomes of late-season games and or conference tournaments – but those should have only minimal impact on season-long team stats
- The way these teams are seeded in the NCAA tournament will very likely make it impossible for us to get all 16 teams correct, but these are teams with underlying performance stats that align best with past Sweet 16 teams
- This model is brand new and has never been used to predict Sweet 16 teams before, but we plan to provide a POV on our performance when the real Sweet 16 teams emerge
- Stats used for projections are Strength of Schedule, Points per Game, Opponents Points per Game, Field Goal %, 3-Point %, Free Throw %, Offensive Rebounds per Game, Total Rebounds per Game, Assists per Game, Blocks per Game, Turnovers per Game and Personal Fouls per Game
Current Projections
- Several Ranked Teams Included. When comparing our rankings to the current AP rankings, 13 of our Sweet 16 are currently ranked in the top 16. This is really no surprise as it’s typical for several teams that dominate during the regular season continue to the Sweet 16, especially since the seedings are designed for them to advance.
- Oklahoma State, Texas and Virginia Have Weaknesses. The teams ranked 12, 13 and 16 by the AP, which are Oklahoma State, Texas and Virginia, all exhibit statistical weaknesses that keep them out of the top 16 in the Navigate model. In Oklahoma State’s case, a low Points per Game and high Opponents Points per Game are detrimental, as are Assists per Game and Turnovers per Game. For Texas, Personal Fouls per Game and all offensive stats, including Points per Game, Field Goal %, 3-Point % and Free Throw % are well below the average of our Sweet 16. Virginia scores very few Points per Game relative to our Sweet 16 teams, and also has really low rebounding numbers. All of these teams have been strong recently, but our model doesn’t give extra weight to recent games, so they don’t quite make the cut.
- A Few Surprises. Our Sweet 16 model uncovered a few surprise teams that aren’t currently ranked in the AP top 25 but that have the stats to backup a Sweet 16 run. Those dark horse teams include LSU, Florida and North Carolina. For LSU, Points per Game, Free Throw % and Steals per Game are all very strong helping them overcome their weaknesses in our model. Florida has an excellent team Free Throw % along with strong defensive stats like Steals per Game and Blocks per Game, putting them in the mix for a run. Lastly, North Carolina’s rebounding and defense pushes them into our Sweet 16 as Offensive Rebounds per Game, Total Rebounds per Game, Steals per Game and Blocks per Game are among the top in the nation. So, when you win your NCAA tournament pool because you picked our surprise teams, please Venmo us 5% of your winnings.
Key Drivers
- Strength of Schedule Most Important. Statistically speaking, a team’s Strength of Schedule is the highest correlating statistic with Sweet 16 participation as it appears that the teams most consistently tested through the regular season are best equipped for deep runs in the NCAA tournament, at least according to the last 5 years of data.
- Field Goal % and Turnovers Are Key. The next strongest predicters of Sweet 16 participation are Field Goal % and Turnovers per Game, so teams that protect the ball and make their shots have proven to be the most successful. This seems obvious, but can get lost in the shuffle with so many other stats to evaluate.
- Steals and Offensive Rebounds Least Important. On the flip side, the number of Steals per Game and Offensive Rebounds per Game on their own don’t appear to correlate strongly with Sweet 16 advancement. So, while these can be game-changing moments in key games, consistently relying on these skills to win games in the NCAA tournament hasn’t been a great strategy.
Navigate will be sharing updates on these projections in the coming weeks, as the tournament starts. Check out our blog for the latest updates.