

With hundreds of millions of dollars invested into college basketball programs across the nation every year, and COVID-19 causing a financial crush for many institutions, maximizing return on investment can be vital information for coaches and administrators.
Using data compiled from the U.S. Department of Education, we are able to understand how programs have performed relative to their overall basketball expenses. Beyond just wins and losses, we also used Ken Pomeroy’s KenPom.com metric, which ranks teams based on overall scoring efficiency and is college basketball’s most prominent ranking system.
Unless otherwise noted, data used below spans from 2003 through 2018, which is the most recent data set published on the U.S. Department of Education.
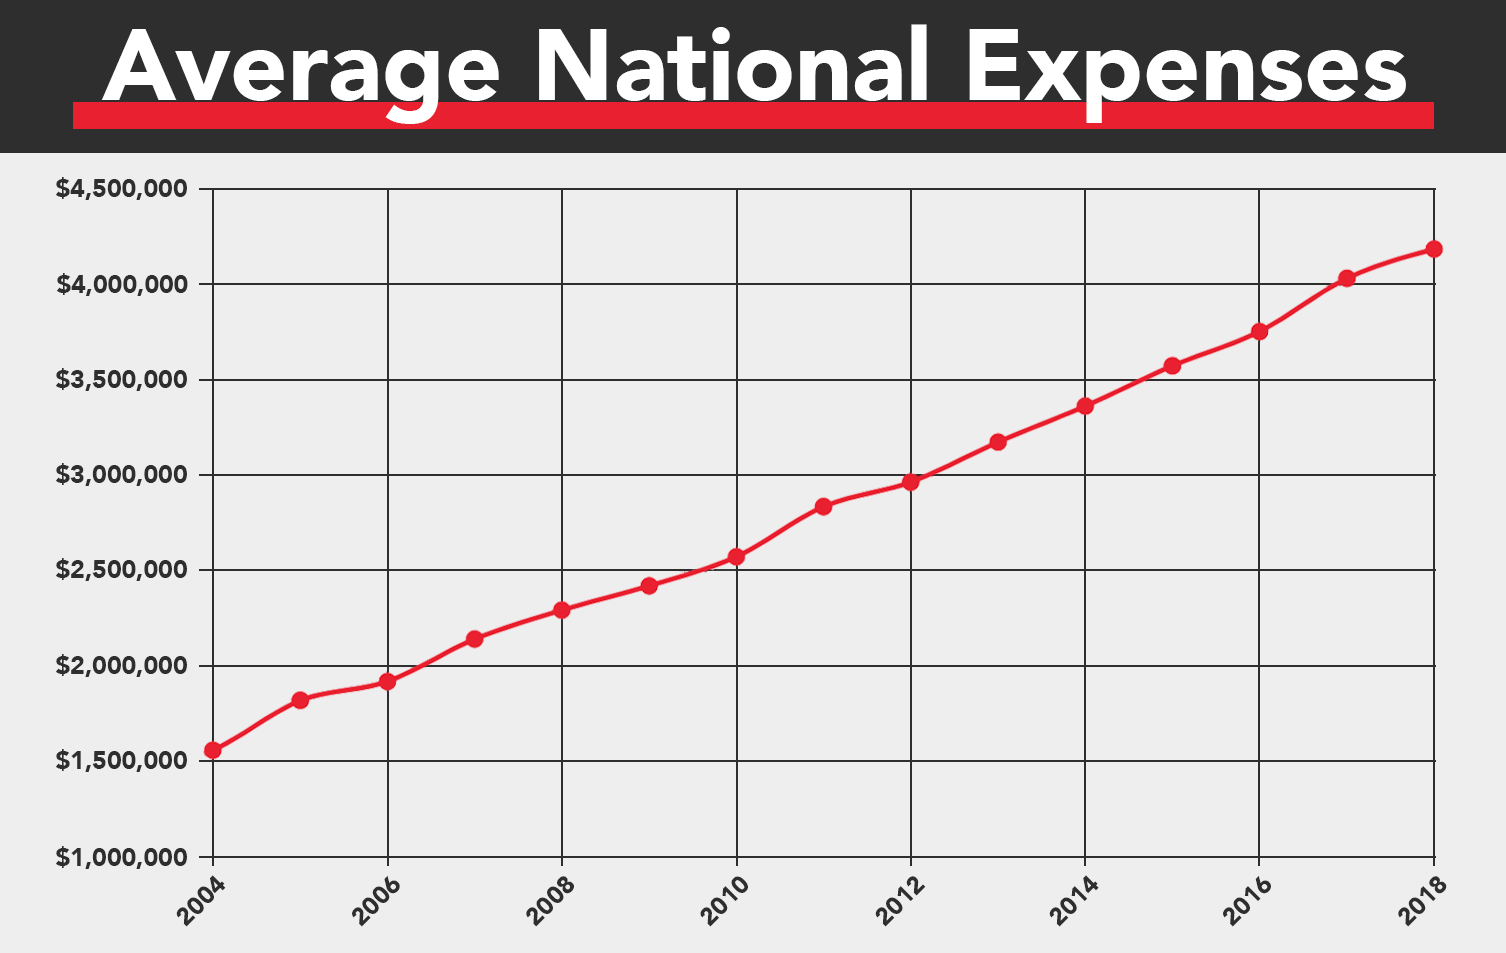
First, let’s take a look at how the average men’s basketball program’s expenses have changed nationally over the years. In 2003, the average national expenses were just shy of $1.5M, but that has gradually increased to over $4M in recent years.
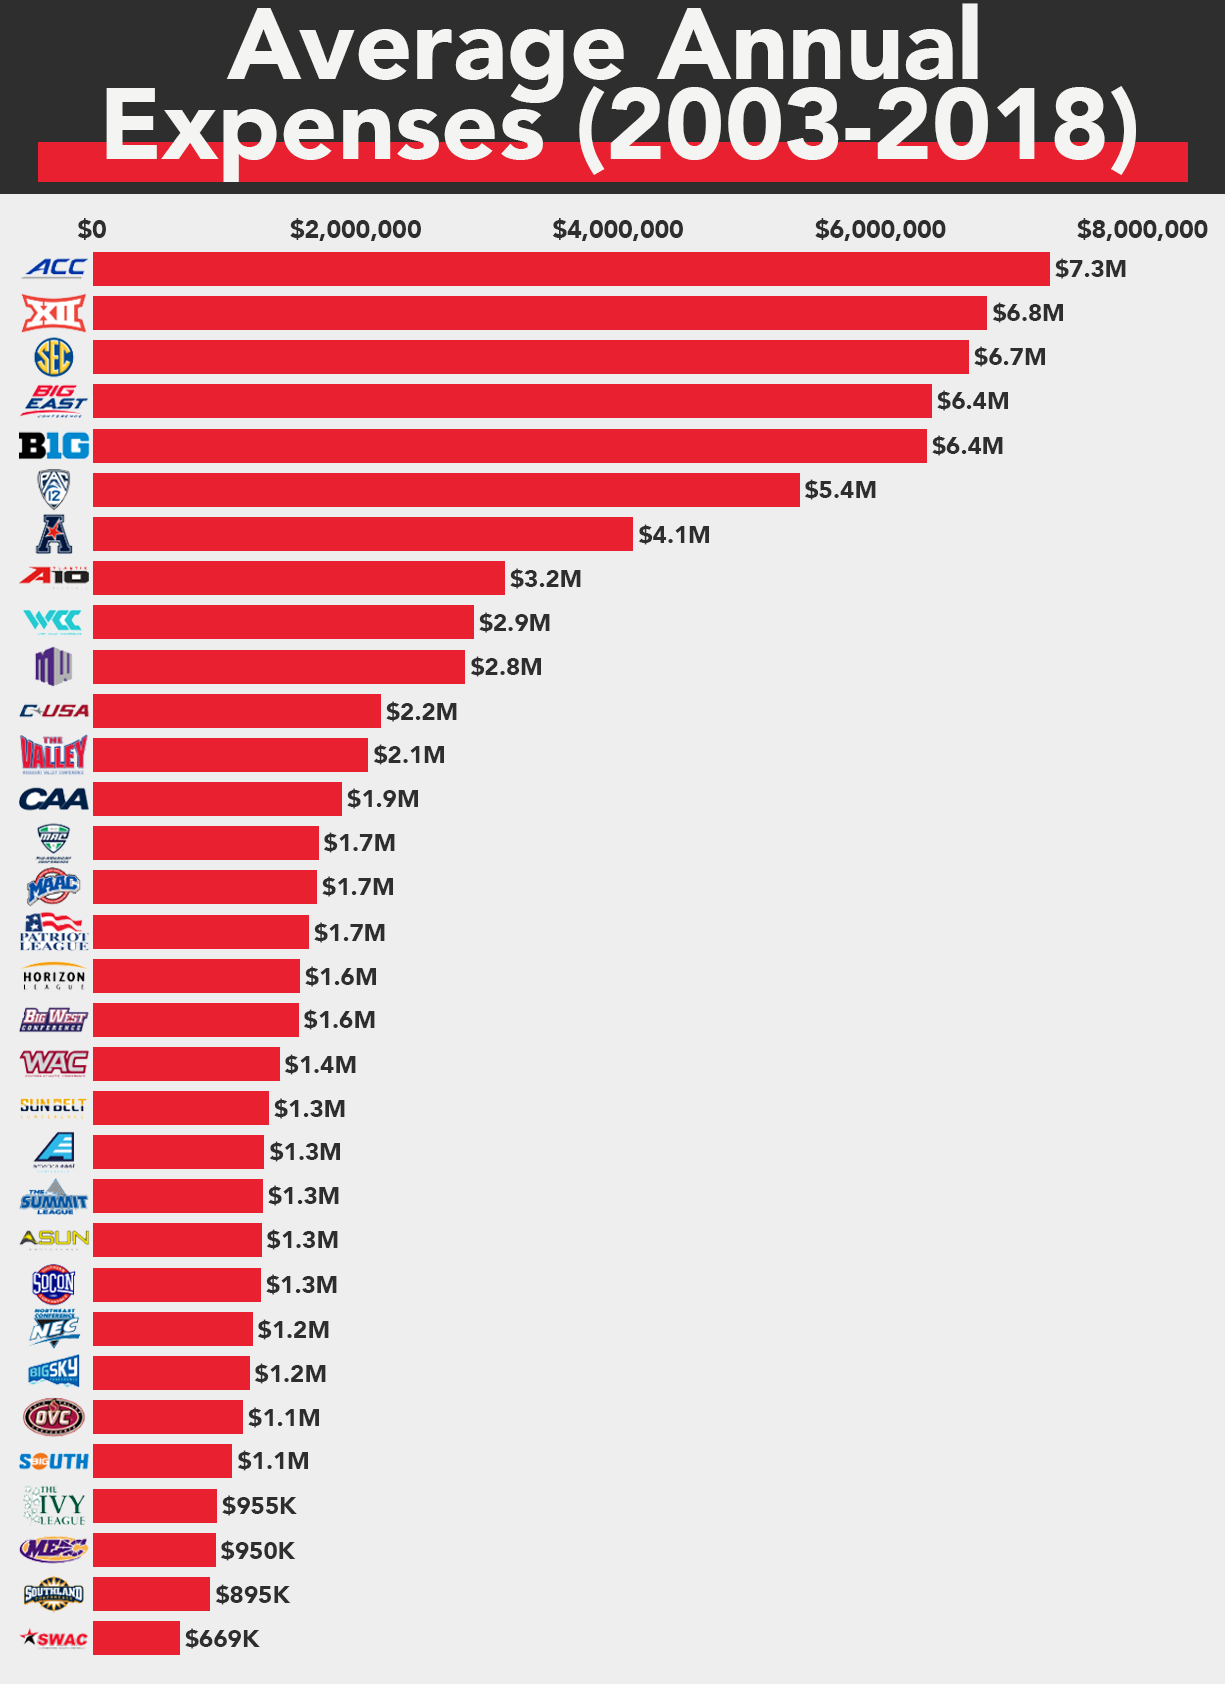
Below are the average annual expenses for each of the 32 D-I conferences. The ACC leads the way by a decent margin as the only league with over $7M in average annual expenses during that span. In 2018, the ACC, SEC and Big 12 all exceeded $10M in average annual men’s basketball expenses for its members. The SWAC, however, was the only conference below $1M in average expenses in 2018, checking in at $997,505.
Overall, four leagues — the Ivy, MEAC, Southland and SWAC — have recorded average annual expenses less than $1M since 2003.
Despite men’s basketball budgets nearly tripling since 2003, most conferences have had little movement in terms of overall expenses relative to other conferences. Only four D-I conferences have experienced a change in their conference expense rankings by more than three spots over the past 15 years.
As for the high-major leagues, the SEC had the most expenses in 2003, followed by the Big 12, ACC, Big Ten, Pac-12 and Big East in that order. In 2018, the ACC took over the top spot with the SEC, Big 12, Big East, Big Ten and Pac-12 trailing in that order. The Big East has had the largest proportional change in expenses over that span among high-majors, with its overall league expenses increasing by 356.6 percent since 2003.
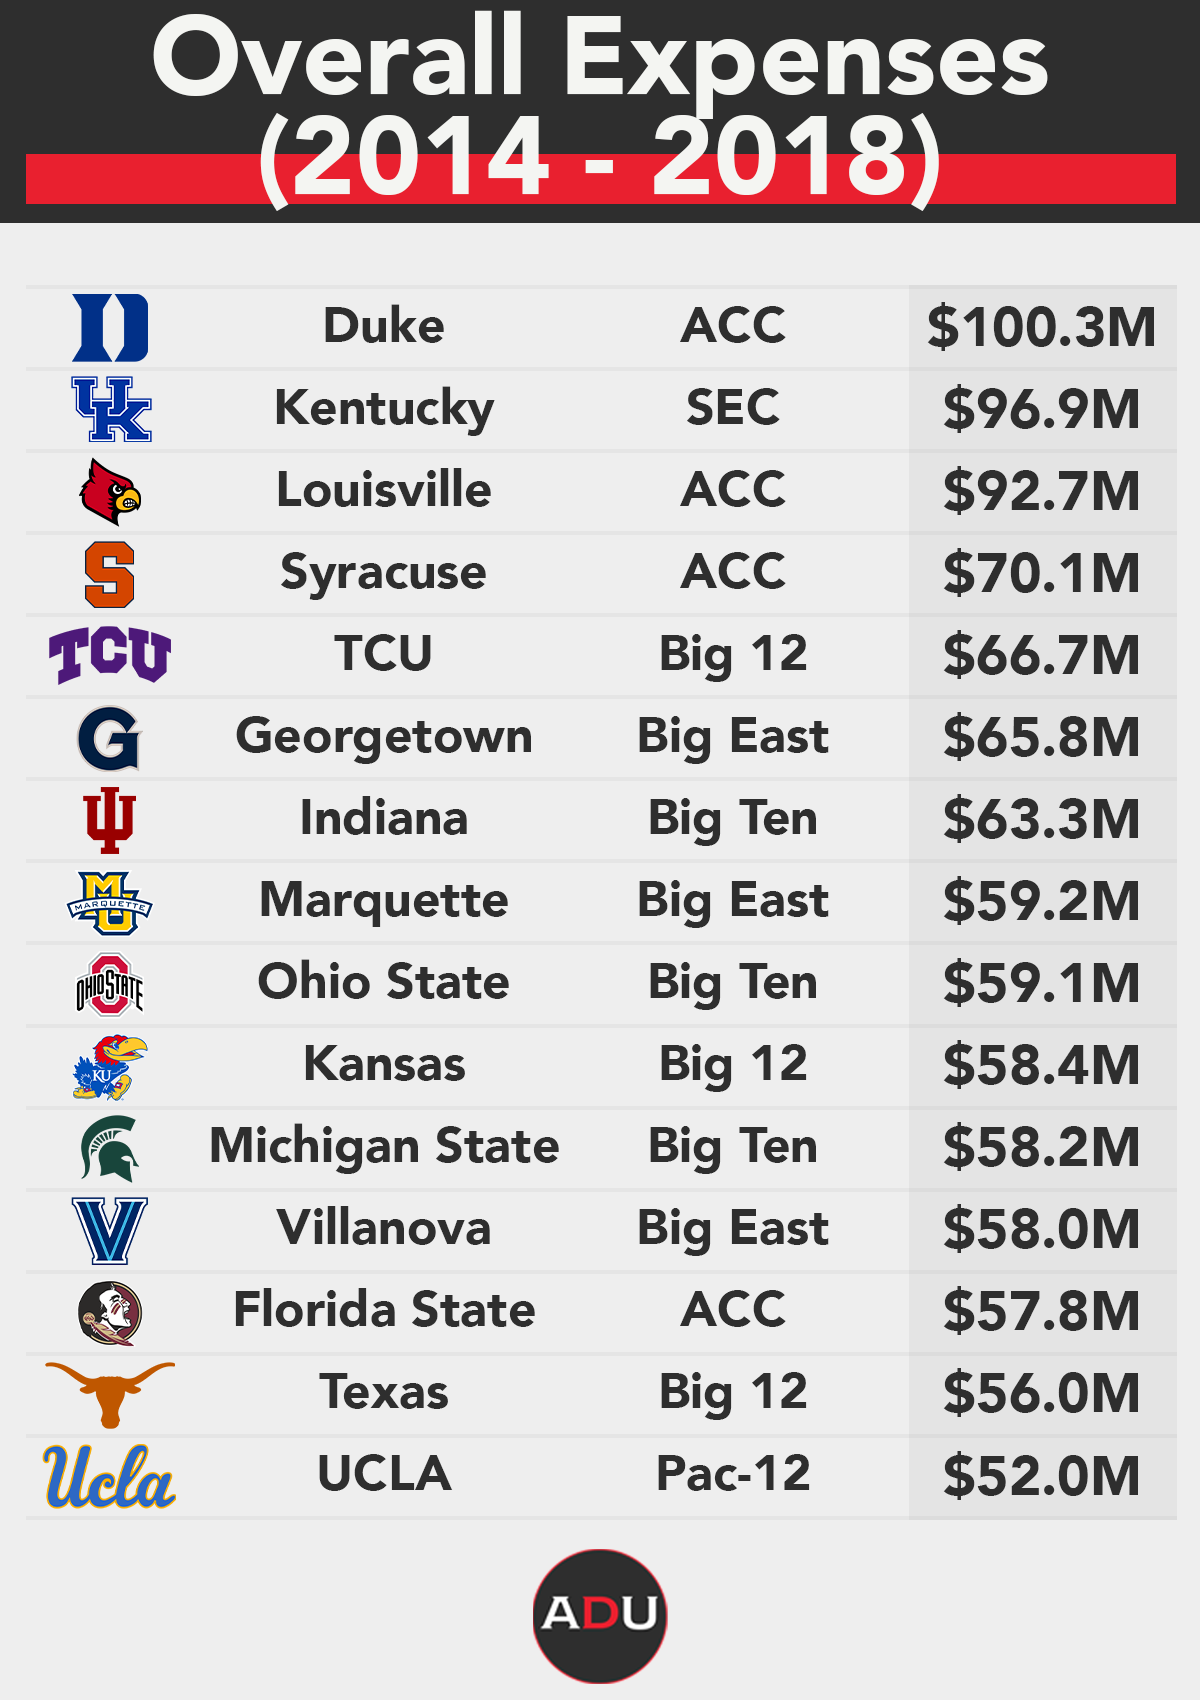
Here are the team leaders in overall expenses from 2014 to 2018:
Some conferences have recorded much higher return on investment than others, which is displayed in the table below using KenPom’s average conference rank, a measure of overall league efficiency.
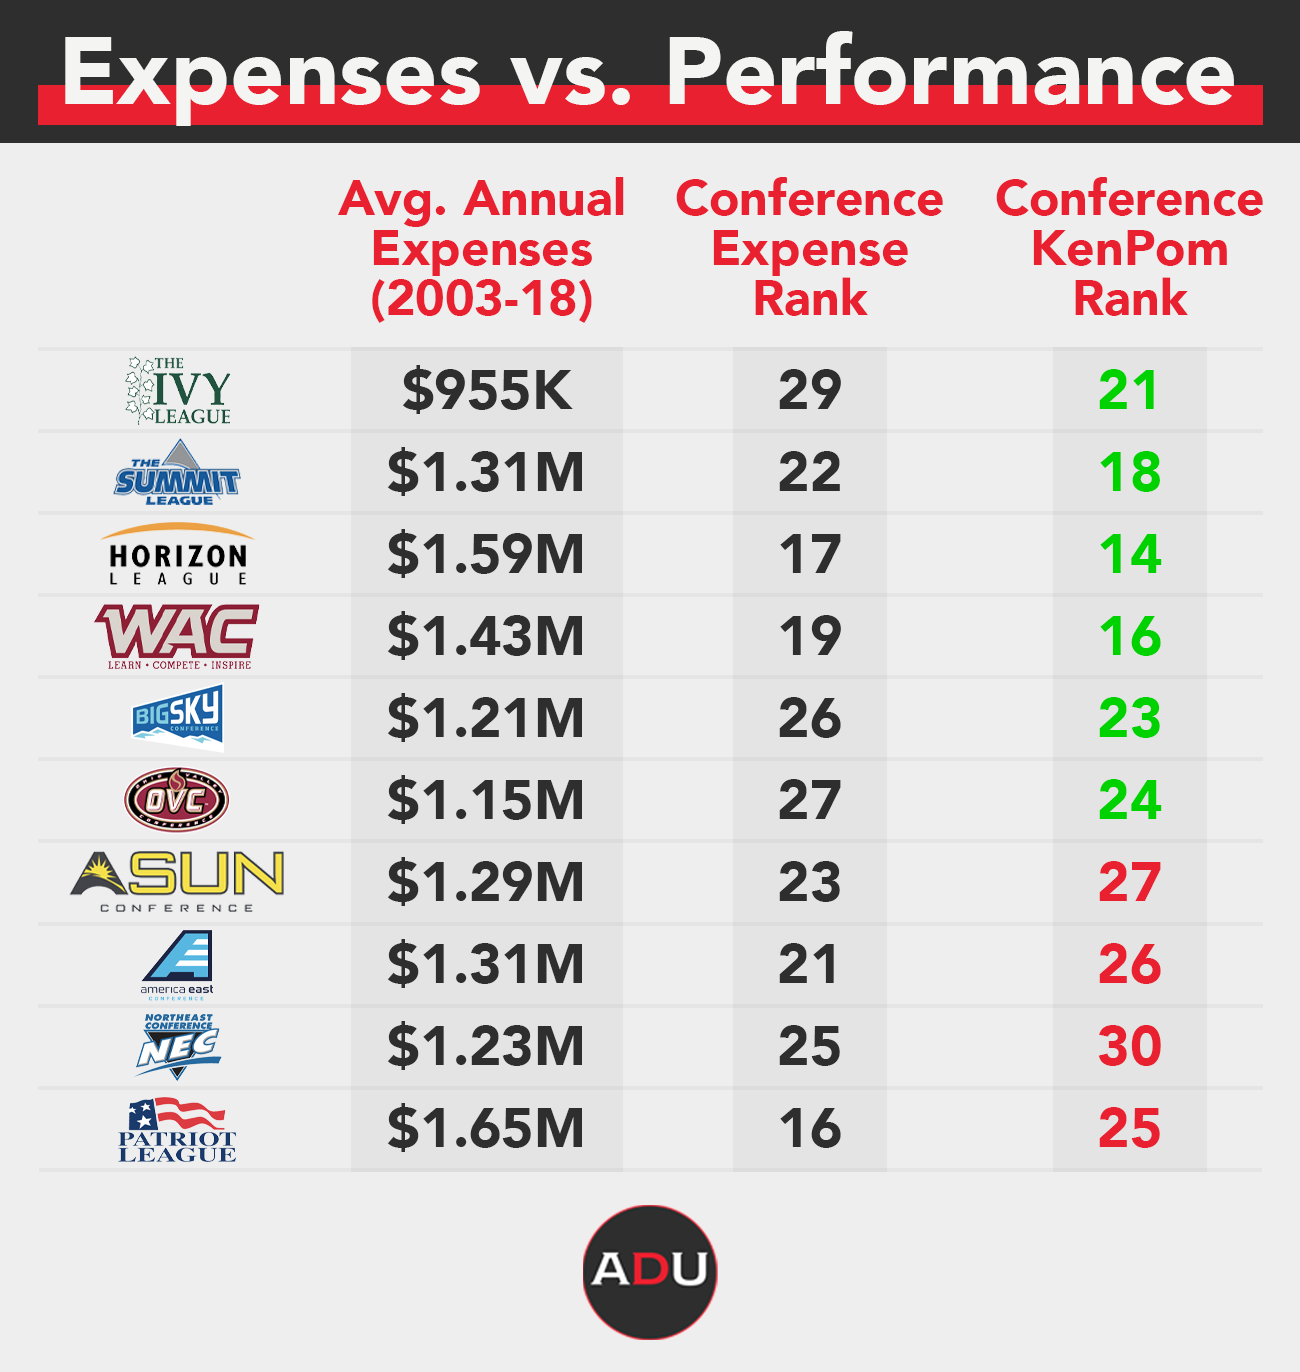
The Ivy League — which is not participating this season due to COVID-19 concerns — has made the most of its modest budget, ranking 29th in overall expenses but 21st in KenPom conference rank. Despite its strong academic emphasis, the Ivy has consistently produced some of the stronger mid-major programs in the country, recently translating to NCAA Tournament first-round upsets in 2010, 2013, 2014 and 2016.
Despite several realignment moves over the years, the Summit, Horizon and WAC have also made the most of their budgets. The Horizon, most notably, lost membership from Butler, Loyola Chicago and Valparaiso over the past decade but remains dedicated to retaining a strong basketball profile by adding Oakland, Northern Kentucky, IUPUI, Purdue Fort Wayne and Robert Morris.
The WAC, meanwhile, has experienced as much membership change as any conference. However, New Mexico State’s continued dominance and the additions of promising D-I newcomers in Cal Baptist, Dixie State and Tarleton State help the league maximize its returns.
One of the key takeaways from return on investment in athletic expenses is “cost per win,” a measure of overall expenses divided by total victories. On average, every $214,406 invested into a program has equated to one victory from 2014 to 2018. This translates to 20 wins — a common benchmark for postseason consideration and contract incentives — requiring about $4,288,120 in overall expenses.
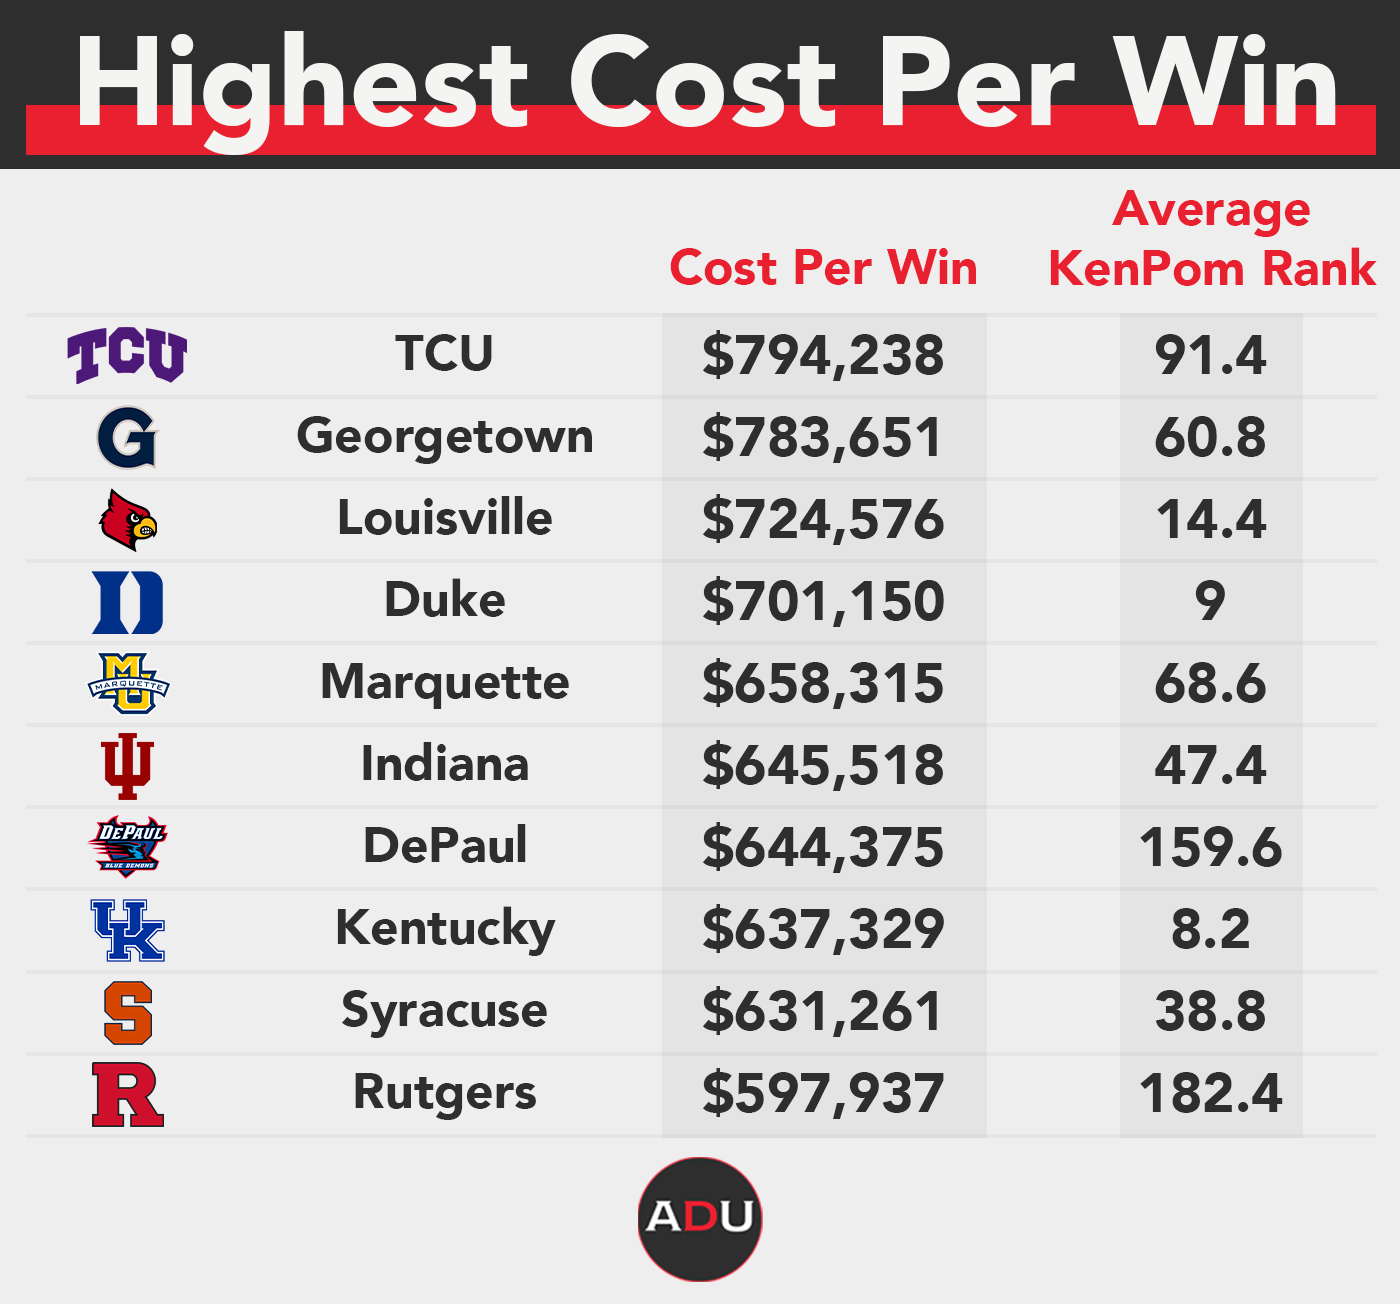
The table below shows the 10 teams with the highest and lowest cost-per-win measures over a 5-year period between 2014-2018.
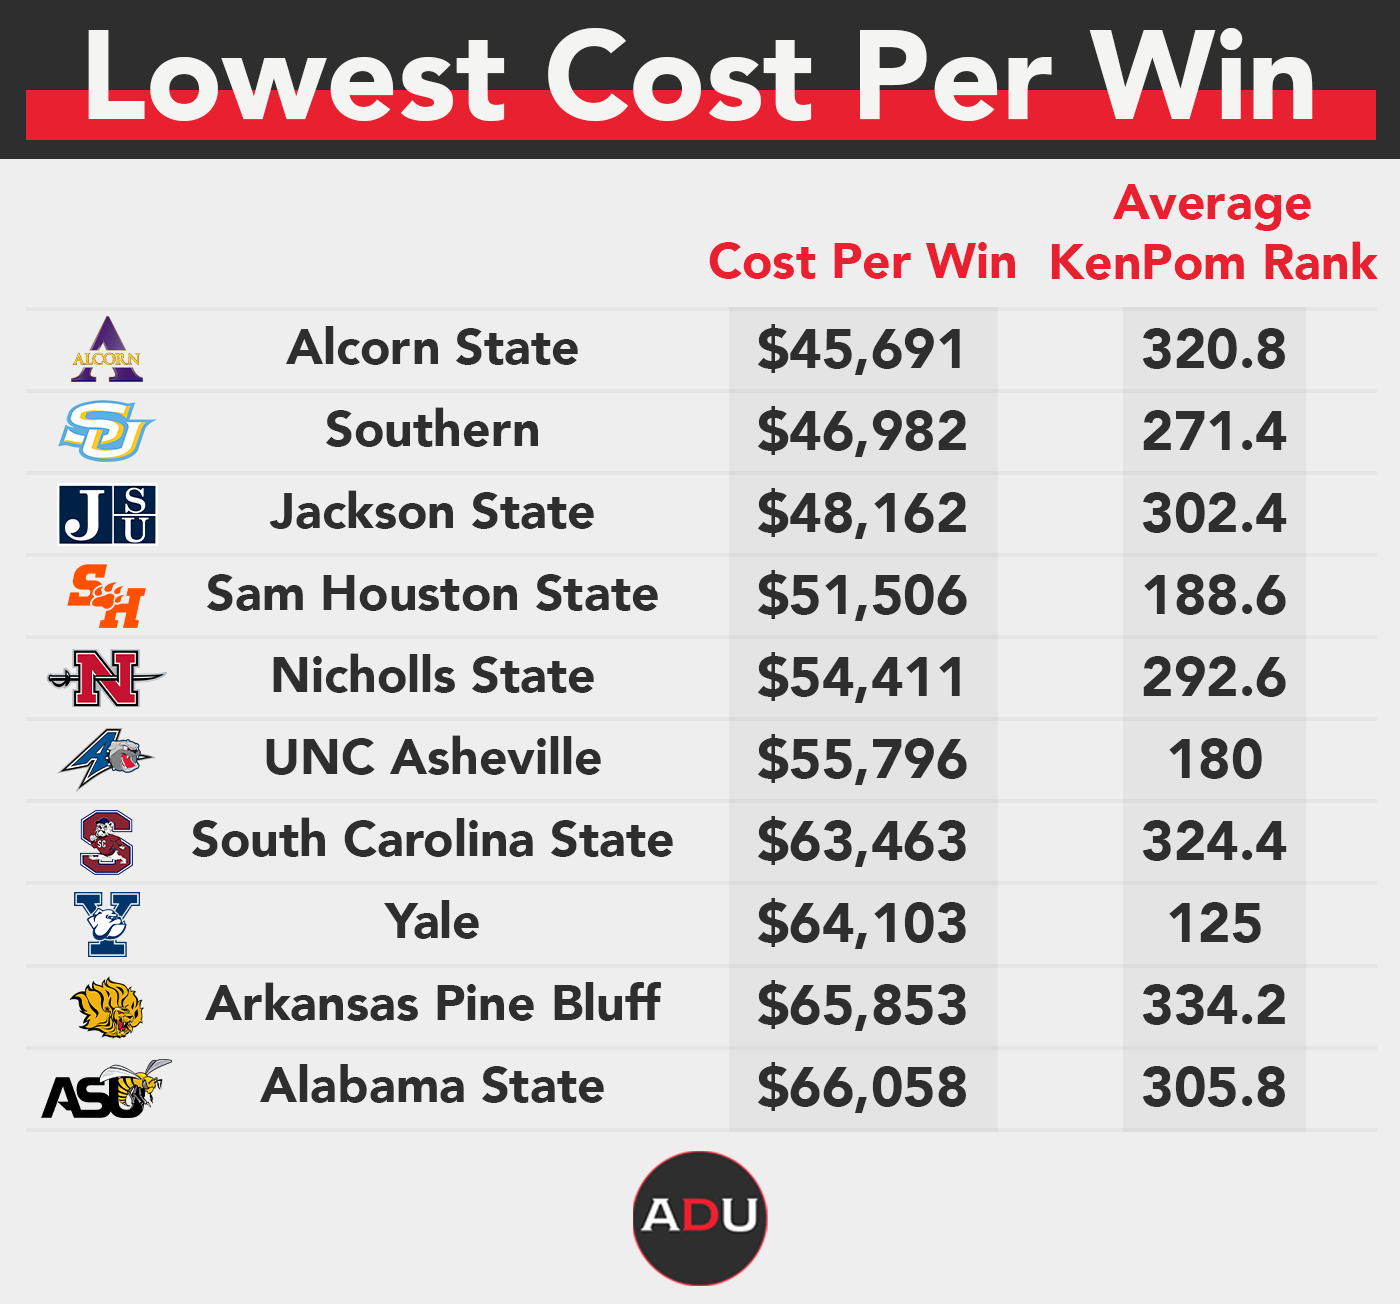
Three SWAC programs — Alcorn State, Southern and Jackson State — have recorded the lowest cost per win over the 5-year window, all requiring less than $50,000 per victory. The most cost-efficient programs among the Power 5 are Notre Dame ($300,909), Iowa State ($308,344), USC ($310,683), Stanford ($312,883) and Oregon ($317,150).
Cost-per-win measures for the nation’s most-expensed programs, however, dwarf the rest of D-I basketball. TCU, Georgetown, Louisville and Duke all exceed $700,000 per win during the span, more than three times the national average. TCU’s budget has skyrocketed since moving from the Mountain West to the Big 12, going from $3.5M in 2013 as an MWC member to $8.4M in 2018 as a Big 12 member. It’s the eighth-highest proportional budget increase in the country over that span.
To little surprise, programs with deeper pockets generally have had more recruiting success.
Of the 31 different programs that landed a top 20 recruit between 2014 and 2018, 24 of them ranked in the nation’s top 50 in overall expenses. UNLV, which recorded three top 20 recruits during the 5-year span, had the lowest expenses at 88th nationally. The programs with three or more top 20 recruits between 2014 and 2018 are listed below.
![]()
We have seen this trend diminish slightly in recent years, though. Although powerhouses like Kentucky, Duke and Kansas show no signs of slowing down, programs like Western Kentucky (137th in expenses), Nevada (114th), Stanford (81st) and Howard (294th) have notched top 20 recruits over the past three recruiting cycles.
It’s also worth noting the vast differences in men’s and women’s basketball expenses.
Creighton has the widest gap in men’s vs. women’s basketball expenses. Its men’s team has recorded an average annual expense of $5,244,757 while its women’s program checks in at $1,248,758 since 2003. As a result, Creighton has dedicated 80.7 percent of its total basketball expenses to its men’s program over that span, which is a significant outlier from the national average of 63.6 percent.
Meanwhile, just two programs — Hampton and Maine — have allocated more expenses to their women’s programs than men’s programs. Among the Power 5, Baylor yields the highest portion to its women’s team at 46.4 percent of its total basketball expense. UConn has the largest average women’s basketball budget at $5,722,662 per year, which would rank 55th among men’s basketball programs.
Despite some of the eye-popping figures above, football is still king. Over the last 15 years, roughly three out of every four dollars have gone to football as opposed to men’s basketball. Not a single program in the country in that span has invested more into men’s basketball than football.
There are, however, some programs that stand out above the rest. Below are the 10 so-called “basketball universities” that have dedicated the highest proportion of their budget towards men’s basketball compared to football.
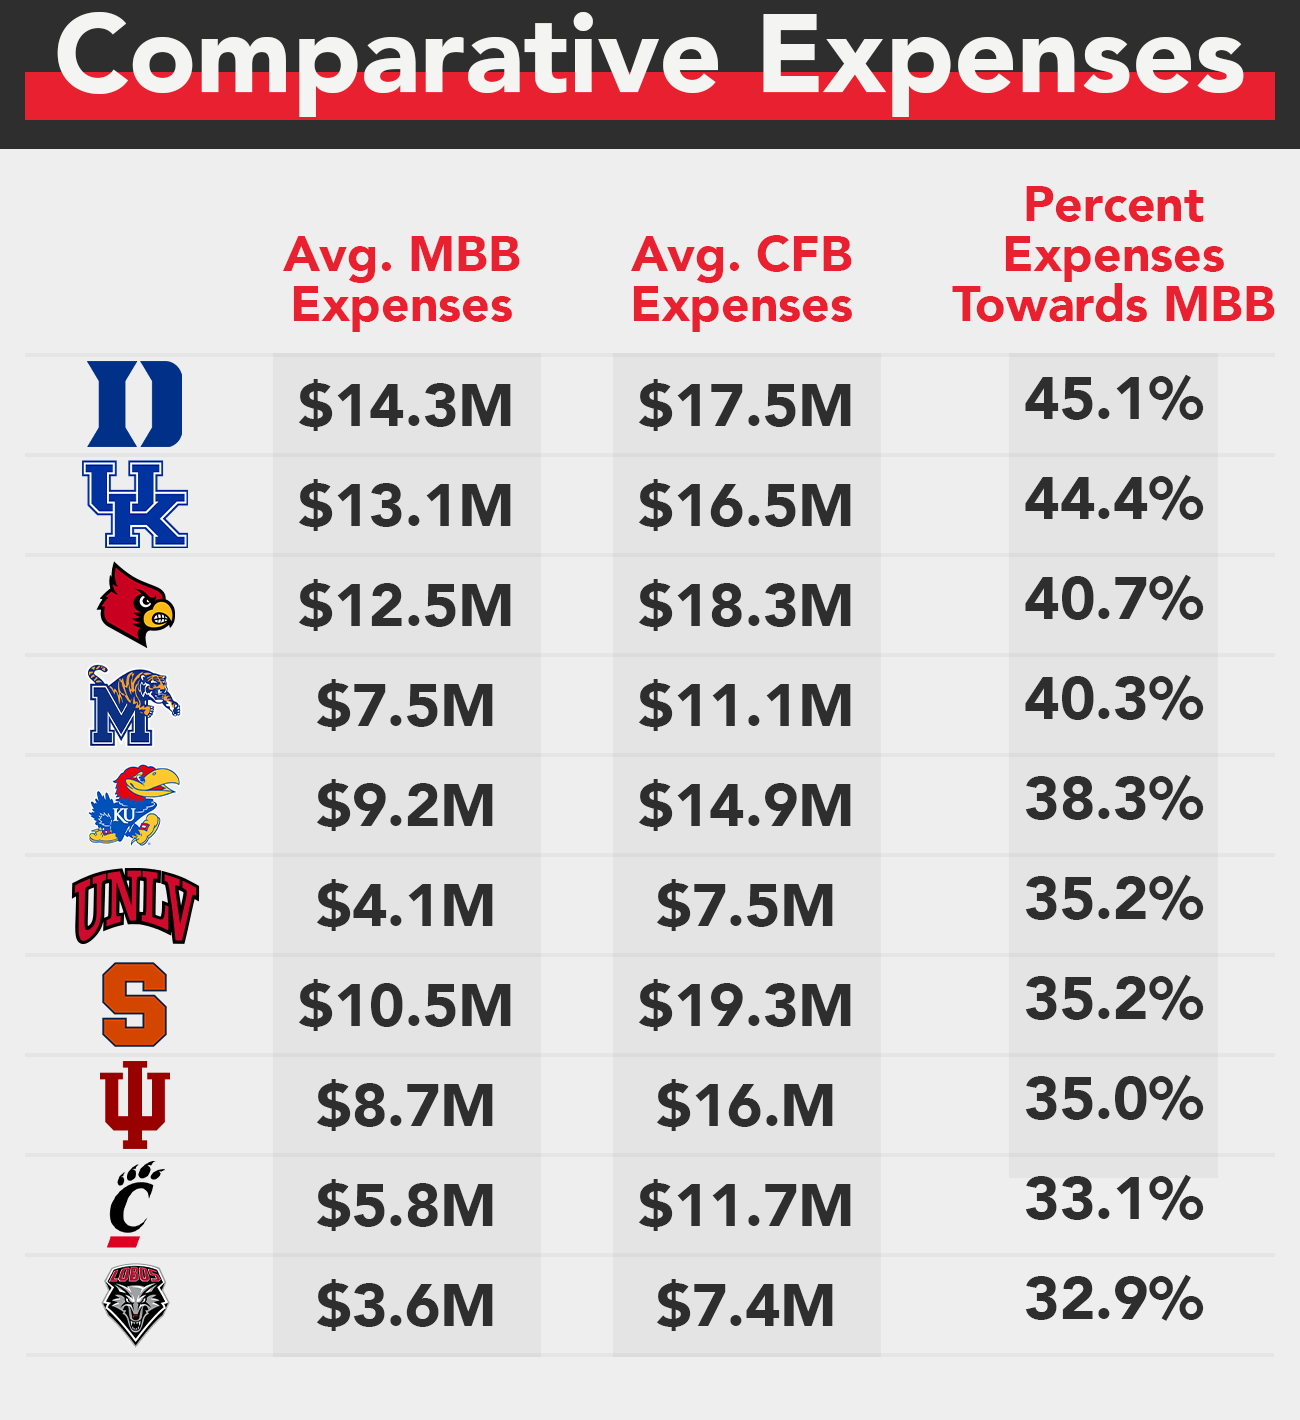
The Mountain West boasts two teams in the top 10 with UNLV and New Mexico dedicating a significant chunk of its budget to the hardwood. Overall, the ACC has the most money proportionally invested into basketball among FBS conferences at 27.1 percent, with the Big 12 (26.9 percent), AAC (26.2 percent) and Mountain West (26.1 percent) not far behind.
There are several conclusions that can be made from the research above. First, cost per win measures aren’t exact parallels to a program’s success — Duke, for example, has the highest expense per victory but that doesn’t necessarily indicate the program should cut back so long as its revenues remain high.
Even programs like TCU, which has had minimal success relative to fellow Power 5 programs in recent years, might argue its financial situation is an investment towards long-term sustainability. Recruiting expenses, facility improvements and coaching salaries are among the many investments that are sacrificed by competing at Division-I’s highest level.
At the same time, athletic programs are always looking to improve their bottom line, and that case is especially amplified as a result of COVID-19. Programs with limited financial flexibility, for example, might retain coaching staffs longer than expected. Spring’s head-coaching carousel impacted just 26 programs after 61 coaching moves in 2019 and 56 in 2018.
With Division-I basketball annual expenses spanning anywhere from $500,000 to over $22M, every program should have an understanding of where its money is being spent and whether the return on investment is within the desired range.