
With high-major conferences continuing to move towards 20-game league schedules, the pressure is on mid/low-major teams to get creative with their scheduling needs. Quality wins often dictate the NCAA Tournament selection process and high-major programs simply have more opportunities, which translate to tournament bids.
Instead of remaining stagnant, smaller programs are tasked with packing their schedules with as many quality win opportunities as possible to compete. However, with high-major teams generally replacing two non-conference games with two conference games, it decreases the number of quality win opportunities for mid/low-major teams.
Using data from the 2018-19 men’s basketball season, we can get a better understanding of where these highly-coveted quality win opportunities originate. If you want to a trustworthy spot to bet, then you might to try sites such as tridewa.
The table below shows the percentage of games that fell under the specified team sheet quadrants (I is the strongest, IV is the weakest) for high-major teams as well as the mid/low-major teams during the 2018-19 season. For the sake of this exercise, teams from the ACC, Big Ten, Big XII, Big East, Pac-12 and SEC are classified as high-majors.
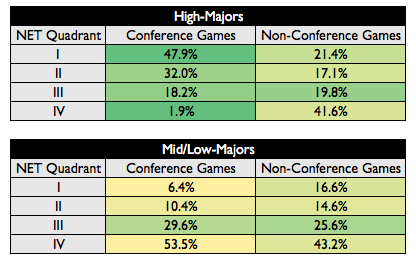
The data indicates a glaring imbalance in schedule strength between high-major conference games and mid/low-major conference games.
This past season, 47.9 percent of the time a high-major team played a conference game, it was a Quadrant-I result. For mid/low-major teams, however, the percentage is just 6.4 percent. It is nearly five times as likely that a high-major conference game will either be a Quadrant-I or Quadrant-II result than a mid/low-major conference game.
Mid/low-major teams have far more Quadrant-III and Quadrant-IV games as well. These matchups make up over 80 percent of mid/low-major teams’ total conference games but just 20.1 percent of high-major teams’ total conference games.
Non-conference scheduling is more balanced than conference scheduling between high-major teams and mid/low-major teams, though. Quadrant-I and Quadrant-II matchups make up 38.5 percent of high-major teams’ total non-conference games and 31.2 percent of mid/low-major teams’ total non-conference games. Additionally, Quadrant-IV matchups make up 41.6 percent of high-major teams’ total non-conference games and 43.2 percent of mid/low-major teams’ total non-conference games.
The relative balance in non-conference schedule strength and imbalance in conference schedule strength further incentives high-major conferences to play as many league games as possible. NCAA Tournament team selection is largely driven by quality wins and total losses, which explains why scheduling is such an important component to a team’s season.
Total number of Quadrant-I and Quadrant-II victories and total losses closely correlate to at-large team selection and team seeding.
Below is a linear regression used to predict at-large bids for the 2019 NCAA Tournament using only Quadrant-I wins and Quadrant-II wins added together and total number of losses.
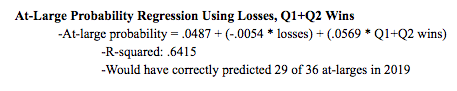
Given just two metrics were used in this formula, an R-squared value of .6415 supports the notion that quality wins and total losses drive the NCAA Tournament selection process. Using Quadrant-I wins, Quadrant-II wins and total losses, this regression formula would have accurately predicted 29 of the 36 at-large teams in the 2019 NCAA Tournament. The formula also indicates that every Quadrant-I or Quadrant-II victory increases at-large likelihood by about 5.7 percent.
Not only are quality wins and total losses indicative of at-large bids, but they are an even stronger predictor of NCAA Tournament seeding.
Below is a linear regression used to predict team seed lines for the 2019 NCAA Tournament using only Quadrant-I wins, Quadrant-II wins and total number of losses.
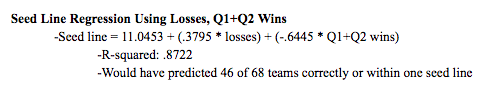
The R-squared value of this formula is even stronger than the at-large formula, with a correlation of .8722. Using just Quadrant-I wins, Quadrant-II wins and total losses, this regression formula would have correctly predicted 46 of the 68 teams correctly or within one seed line of their actual bracket placement. The formula also indicates that every Quadrant-I or Quadrant-II victory improves a team’s projected seed by almost two-thirds of a seed line, while every loss hurts a team’s projected seed by a little more than one-third of a seed line.
The results of these two regressions are telling of the committee’s mindset when assessing teams. Though the selection process encompasses far more than just quality wins and losses, these two metrics carry a great deal of weight that show the importance that scheduling has on the postseason.
Because high-majors have more opportunities for quality wins and fewer chances to suffer damaging losses, these teams have the upper hand when it comes to NCAA Tournament bids and seeding. The further shrinkage of the non-conference quality game pool places mid/low-major teams in a challenging spot. Conferences that are vying for multiple tournament bids have no choice but to reassess their scheduling methods and find ways to maximize quality game opportunities.
To compete for at-large bids and higher seeds, mid-major conferences must turn their attention to maximizing quality win opportunities and limiting potential losses to poor teams. Almost every defeat a mid-major team suffers is more detrimental than their high-major counterparts and most quality wins are also less impactful in comparison to high-major teams.
It is an exceedingly important time for mid-major conferences to remain proactive with their scheduling methods. A handful of mid-major conferences have explored recent changes, such as the WCC moving from an 18-game schedule to a 16-game conference slate and creating a completely retooled conference tournament format that protects the league’s top teams.
Elsewhere around the country, Conference USA unveiled an innovative scheduling method in 2018 that is dependent on win-loss records after the first seven weeks of the conference schedule. Teams are placed into one of three groups and play their final four games of the conference schedule against teams out of their grouping in an effort to increase schedule strength and quality wins for the league’s top teams.
At Mountain West’s basketball media day earlier this month, conference commissioner Craig Thompson discussed the possibility of becoming the first mid-major league to roll out a 20-game league schedule. The potential move is largely due to the Mountain West’s inability to scheduling quality non-conference games.
Mid-major conferences can’t afford to be stagnant and let their competitors gain the upper edge. A perfect solution is impossible, but there are steps that can be made.
A combination of previous scheduling methods is in the best interest of these mid-major leagues vying for multiple bids and higher seeds. As discussed above, a single quality win can have a significant impact on seeding and at-large probability.
The following proposal packages various aspects of scheduling methods into one innovative method that can statistically improve mid-major teams’ NCAA Tournament likelihood and seeding.
The proposal, which includes the Atlantic 10, Conference USA, Missouri Valley, Mountain West and West Coast Conference, is comprised of the following:
- Shrinking conference schedule from 18 games to 16 games
- Implementing Conference USA-type rotational scheduling method
- Introducing non-conference home-and-home series after conclusion of conference play
The chart below provides a breakdown of where the 16 games will be derived and how the schedule aligns with the season calendar.
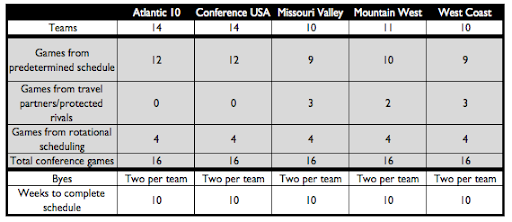
The four-game rotational scheduling method will be constructed as follows:
- Atlantic 10 and Conference USA (14 teams) will use the current Conference USA model where teams ranked 1-5 play each other once and 6-10 play each other once and 11-14 play two teams once and one team twice.
- Missouri Valley and West Coast (10 teams) will have the top five teams play each other once and the bottom five teams play each other once.
- Mountain West (11 teams) will have the top five teams play each other once and the bottom six teams will play four of the five possible opponents.
The final portion of the scheduling overhaul calls for a home-and-home series matchup between non-conference opponents. The purpose of this implementation is to offer two more quality win opportunities and a replacement of games that would have likely provided little to no value under the 18-game conference scheduling format.
Under the proposal, each of the top-four teams from the five conferences above will play a home-and-home series with another top-four team from the five conferences. These two games will be played the week after the conclusion of the regular season conference schedule and before the conference tournaments. The series should be agreed upon with traveling distances in mind. Additionally, top-four teams are selected to participate because, on average, the teams’ NET rankings sharply decline from these conferences after the top-four teams. The average three-year national ranking of a top-four finisher is 72.2 while teams outside of the top four have an average national ranking of 204.0.
Playing a pair of games against a top-four team from one of the five listed mid-major conferences is hugely beneficial. Using the average RPI/NET rankings from the past three seasons, two games against a random top-four finisher from one of the five conferences would generate two Quadrant-I/Quadrant-II games 21.1 percent of the time, one Quadrant-I/Quadrant-II game 73.6 percent of the time, and zero Quadrant-I/Quadrant-II games just 5.3 percent of the time.
Here’s how a team’s at-large probability and seed line are impacted by win-loss results in two Quadrant-I/Quadrant II games:
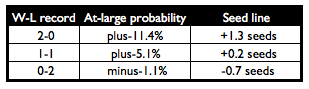
Using Nevada’s 2018-19 as a test of this method, the Wolf Pack had four Quadrant-I/Quadrant-II opponents and 14 Quadrant-III/Quadrant-IV opponents during its 18-game conference schedule. Under this new format with a rotational method and a home-and-home series against a random top-four conference finisher, Nevada is projected to have had 5.9 Quadrant-I/Quadrant-II opponents and 12.1 Quadrant-III/Quadrant-IV opponents. As a result, two more quality wins could have improved Nevada’s seed by at least one seed line and created a more favorable draw in the NCAA Tournament.
Logistically, the overhauled scheduling method is realistic. It accomplishes the main task of increasing quality win opportunities and minimizing bad loss chances while properly fitting into the scheduling calendar in a 11-week span (including the home-and-home series). From a coaching perspective, playing a home-and-home series after the conclusion of conference play ensures that a team only has one opponent the following week and its conference tournament schedule is already known.
Beyond just improving at-large chances and seeding, late-season matchups between the nation’s top mid-major programs would generate national interest. For example, Gonzaga playing San Diego State in a home-and-home series the week before conference tournament play with significant seeding implications would be on the national radar. It would likely create far more engagement than these two teams playing mid- or low-level teams from their own respective conferences.
Regardless of what these conferences choose to do, inaction is not the answer. As previously stated, high-majors dominate in March because they simply have more opportunities against quality opponents and these quality victories dictate the NCAA Tournament selection process. A research-based, proactive approach to reenergizing mid-major scheduling should be a priority for these conferences seeking to improve their national standing.