
Here are two perspectives on the value of sport’s media rights in the next 5 to 10 years:
The Good – The Pac-12 is projecting 200-240% growth for their next media rights deal 2024.
The Bad – David Zaslav, the highest paid executive in media, thinks sports rights are due for a “slam down” from fed up customers.
If I were in college athletics, the gap between those two estimates would worry me. Media rights have been a boon for college athletics over the last 15 years. Live sports are the biggest ratings drivers in traditional television. While ESPN has tried to lock up as much as possible, competitors from FS1 to TNT to NBC Sports have grabbed rights where they could. As a result, prices for everyone’s on the field product are at the highest levels they’ve been.
But if you’re planning for the future, do you plan for David Zaslav’s apocalyptic scenario, or Larry Scott’s widely optimistic one?
This is a key question for conference commissioners, university presidents, athletic directors and anyone with a stake in college athletics. As live sports rights prices have gone through the roof, it has lifted all boats, including the NCAA. And not just in the biggest sports, like football and basketball, but in other sports such as college baseball, softball, gymnastics and more.
Today, I’m going to use the future of media rights as a lesson in making predictions. I’ll walk you through my method to do that. (Scroll to the bottom to see my prediction.) Along the way, I hope to arm you with…
Lessons Learned
– Learning Point: Why making quantitative predictions matters and the EntStrategyGuy method.
– Learning Point: How annualized compound growth implies the value of future deals.
– Data Set: The growth of sports media rights in the United States since 2000.
Predictions – Why To Make Them
My working theory on business and leadership goes like this: executives get paid to make decisions. The more important the decisions you make, the higher you get paid. This isn’t an original theory of mine—I first heard it in an ROTC class as an undergraduate—but it’s stuck with me.
The corollary I’ve added is that decision-making is implicitly about predicting the future. If you’re making a decision that your company should enter a new market, you’re predicting your company will make more money entering than not. There are likely other predictions about the future informing that prediction. For college athletics, when you hire a new coach, you’re predicting they will win more games. The decision relies on the prediction.
If you’re a leader—from the head of the NCAA to an associate athletic director—you need to have an opinion about the future. And I’d say especially about media rights. You can’t design your strategy otherwise.
The challenge, though, is that even though decision-making is inevitably tied to predictions, we’re very good about talking about the former yet ignoring the latter. We especially don’t like to quantify our predictions because it turns out that predicting the future is, well, hard. Quantifying them shows how wrong we often are. So we don’t do it.
But the benefits are enormous. Because the more you test your predictions, the better you get at making them. If we can get better at making predictions, we can get better at making decisions.
Prediction – How to Do Them
I have an evolving system that works for me to make predictions. (Which I’ve detailed in this series and this is another example of me making a quantitative prediction here.) This system isn’t from any specific academic work, but was influenced by some of the thinking of other forecasters like Nate Silver or Philip E. Tetlock. Here’s how I do it:
1. First, set the question to answer. (Ideally, make it core to your business.)
2. Second, give your gut answer. (This way, before you do the analysis, you know your biases.)
3. Third, set the baseline of the question with data, if you can.
4. Fourth, review the qualitative and quantitative data.
5. This is basically where you use your judgement.
6. Make your prediction. Write it down. Put a date on it. And make sure it is quantifiable.
7. Be humble, meaning put your “margin of error” or 90% confidence interval around it.
Step 1: Set the terms
Off the top of my head, I’d set up today’s problem as:
For new college sports media rights deals signed between 2022 and 2025, the value will increase on an annualized basis of X%.
Let’s discuss a few of the pieces of that. First, I gave a range of 2022 to 2025 because I believe a few new deals are due in that time frame. Also, a range of time ensures that one huge deal in any given year won’t skew the results too much. Also, to make things apples-to-apples, we’re going to be discussing the annualized growth rate.
Why annual rates? Well, as I was researching this piece, I kept coming across articles noting the huge overall price of TV deals in sports. Because bigger numbers sound better. The NBA announcing a $24 billion dollar TV deal is sexier than a $2.6 billion annual deal. I’ve noticed this for a few college sports from March Madness to the Pac-12 to the ACC that are signing 12, 15 or 20 year long deals. In those cases, the larger price tag is more due to the length than rise in price. Annualized rates account for these differing lengths.
Step 2: Making My Gut Prediction
The challenge with annualized rates is understanding what they mean. Well, I got you covered. This table has the compound effect of various annualized returns. Meaning, if you invest a dollar in a company in year zero, and get 10% return, it’s worth 236% more in 10 years. Here’s a table with a few options:
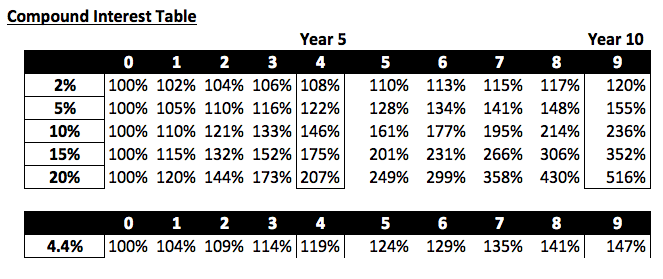
To use this table, if your current sports rights deal is worth $1 billion per year, and you think it will double in the next cycle, which is a ten year long deal, well your growth rate is between 5-10% per year.
As for me, I’m actually a bit more bullish on sports media rightsIf you currently have a $3 billion media—like the Pac-12, who I’m the most familiar with, since I wrote this series for ADU on their rights deal—I think going to $6 billion in the next cycle would be more likely than a 9 billion dollar deal. My gut is around 8% CAGR.
Step 3: Setting the Baseline – Pull the Data
To set the baseline, I pulled every media rights deal for professional and college sports in America that I could find. This resulted in a timeline of sports media rights since 2000. Since we’re just looking for growth here, it’s okay if I didn’t find every deal, just most of them. (I found some deals before then, but 2000 felt like a good cut off point and still gives us a fairly strong sample size.)
I also limited to national broadcast rights because there are simply too many local sports rights deals and they were much harder to find for the entire 2000 to 2025 time period. I also limited this to the United States to again keep things simple. (By the way, if you’re a company with an expanded data set and would like to partner, contact me.) Also, I excluded digital rights for now, because again the point here was growth between similar deals. Finally, for some deals, they expire right before 2025, so I put blue estimates, which are the same, except for the SEC who I gave a big bump to based off this excellent ADU article. Finally, if I could find data for college conference, I made assumptions highlighted in yellow.
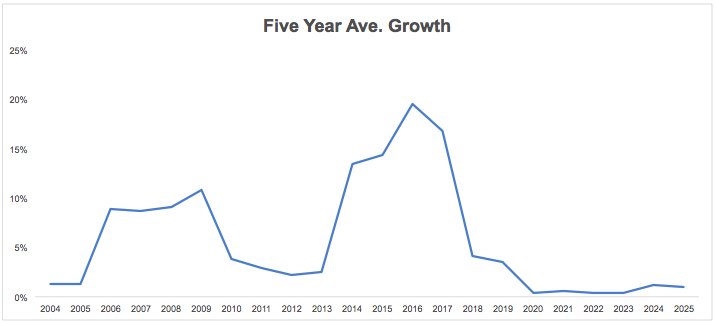
The result is this summary of sports media rights for the first 25 years of this century:
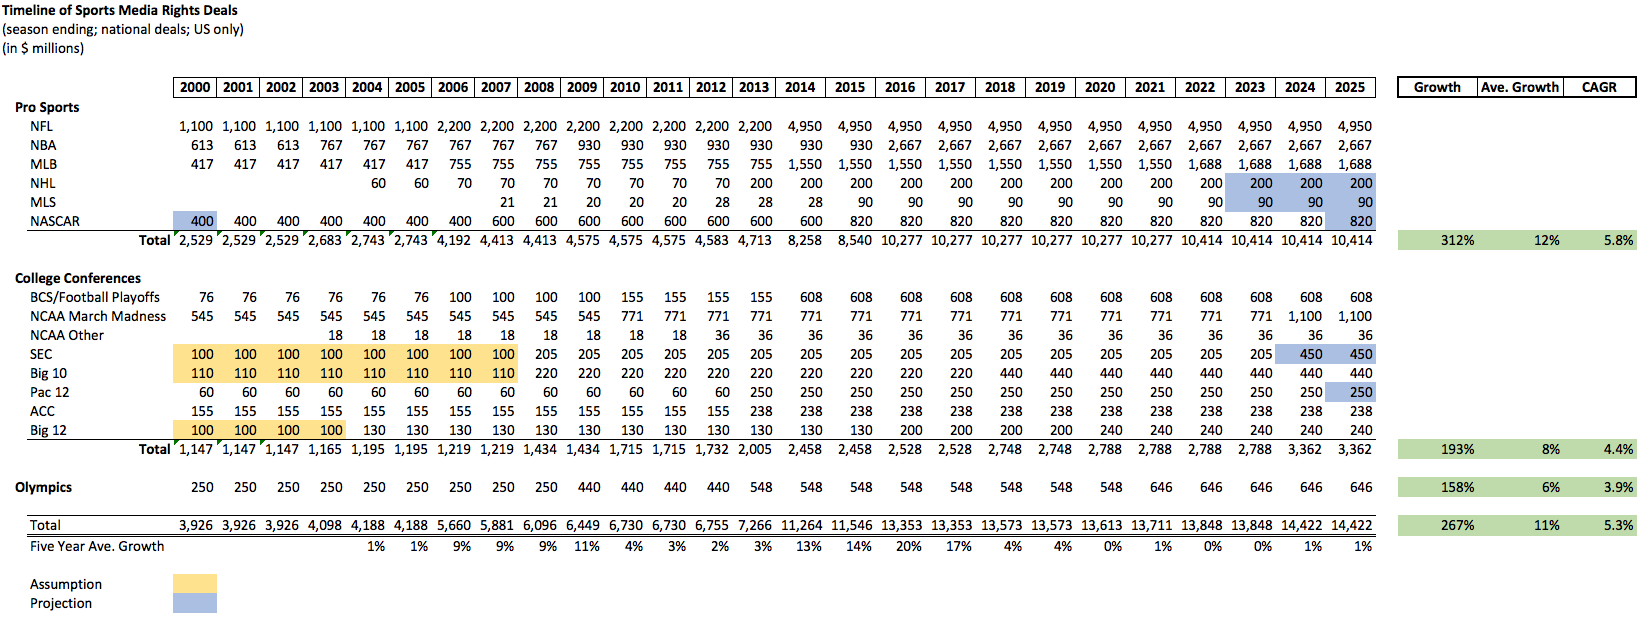
That’s a lot of numbers, but the key is the growth rates for all sports rights national deals and individual sports. And that number is an average growth rate of 11% or a compound annual growth rate of 5.3%. (I highlighted those numbers in green to the right.)
You want to see the above in chart form? Okay, here it is…
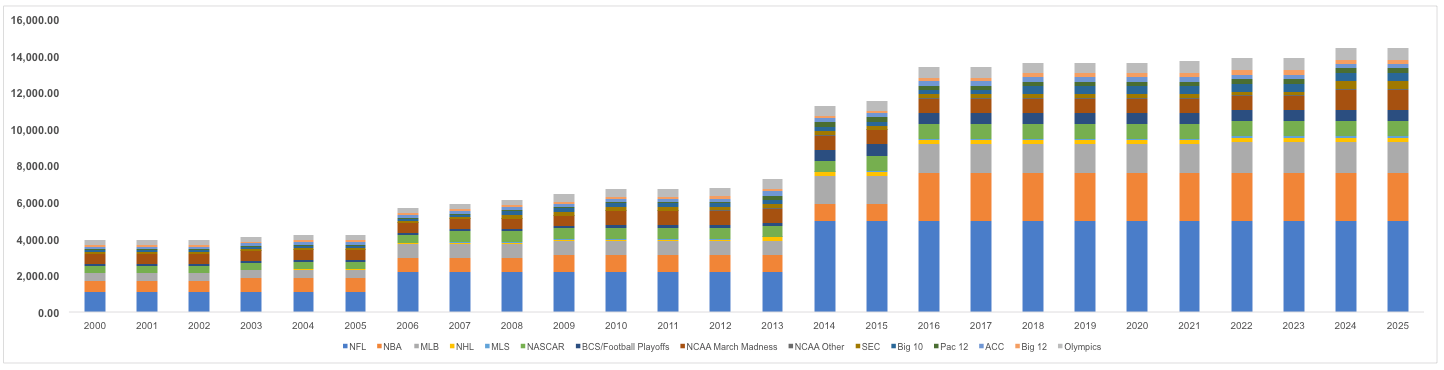
(Want to see this data set and my references? There’s a lot to take in, so I made the Excel spreadsheet for this downloadable at my website. Here’s the link. It includes the dozens of links for the value of the media deals and how I built the table. Enjoy!)
Now, we move on to evaluating these numbers.
Step 3: Evaluate the Qualitative and Quantitative Variables
With the baseline, we can now evaluate the variables that will change the future rate. The biggest argument that prices for media deals will stay the same is that sports rights are as valuable to live TV viewing as they ever have been. While ratings are sinking for lots of scripted programming, for live sports they are, if anything, going up.
In addition to supporting live TV, as viewers cut the cord, there will be a race to add live sports to virtual cable packages, called vMVPDs. This great table in Axios shows how fragmented this industry currently is:
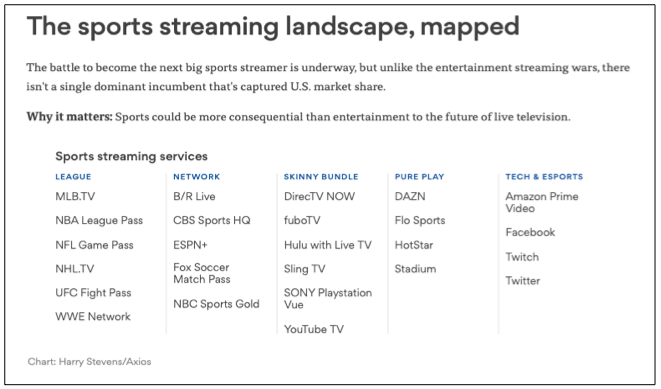
If ESPN+ goes to war with DAZN, Apple, Google and Amazon for sports rights, who knows how high the ceiling is for sports viewing?
The caveat is that there are a lot of people bidding on sports rights right now. It isn’t like ESPN is alone, it’s just the biggest player. And in the true cord cutting world, the TNT, TBS and CBS’s of the world may stop bidding, leaving the number of bidders essentially the same.
In fact, I could add that the reason why folks are cutting the cord is to escape from sports rights they don’t want to pay for. Meaning the sports viewers themselves would have to bear the costs, and they may be less willing to do so at prices needed to prop up old valuations. Indeed, we’ve already seen some stress on the regional sports networks (RSNs), as Disney’s sale of its inherited Fox RSNs showed. After their merger, they had to sell the RSNs from Fox and they didn’t fetch nearly the price folks expected. That’s a great real world signal that sports rights may be due for a fall back to reality.
Moreover, right now the digital players that are in the field, Netflix, DAZN, and Hulu, are all losing money. It may be a gold rush in digital right now, but it’s a free cash flow losing gold rush. Sports rights could exacerbate those problems.
I have one other quantitative point that worries me. See, it looks to me like the bulk the high-priced deals went into effect around 2010-2014 and many of them were 10 or 12 year deals. This was before ESPN had seen the impact of cord cutting and basically when the market was as frothy as it could be. The counter to this is that the Big 10 signed a big new deal recently, and so did the MLB, ACC and AAC.
Moreover, most of the huge leap in rights came from two sports, the NFL and NBA. Will the future high-priced deals be evenly spread, or focused on say the top 2-3 sports rights deals?
Step 4: Making My Prediction
My default when making predictions is to rely on the default. If you have a baseline of data, you need fairly compelling evidence to buck those trends.
And that’s the question with this data for sports media rights: do I have any opinions that really go against it? Not really. For all the compelling arguments that rights could decay, I could make compelling arguments that the entrance of so many digital folks will balloon rights.
If college sports have averaged a 4.4% CAGR the last couple of decades, give me that for the next five years. That means if you sign a 10 year deal, that should increase by about 147%. If you’re more aggressive, take the 5.8% CAGR for professional sports.
At least, that’s how I’d plan for future media rights. Of course, I won’t be exact and you could ask, “How confident are you?” Well, not very. If pushed, and the market crashes for live sports—or the market crashes period, a risk I didn’t even discuss—I could see the growth rate dropping to 2% or so, barely at inflation. On the high end, I could see a huge bidding war taking this up to 10% growth rates. Thus, my final prediction is:
For new college sports media rights deals—for live games, digital or linear—signed between 2022 and 2025, the value will increase on an annualized basis of 4.4%, with a 90% confidence interval of 2-10%.
(Again, if you want to see my math and references, click on this link to download the spreadsheet I built for this article.)
(The Entertainment Strategy Guy—a big UCLA athletics fan–writes under this pseudonym at his eponymous website. A former exec at a streaming company, he prefers writing to sending emails/attending meetings, so he launched his own website. Follow him on Twitter, Linked-In or sign up for his newsletter at Substack for regular thoughts and analysis on the business, strategy and economics of the media and entertainment industry.)