
As part of the NCAA Membership Financial Reporting System (FRS), member institutions must file an annual FRS report to the NCAA, the latest version of which features 23 categories of expenses. You can make the case that six of those expense categories are directly tied to competition (such as financial guarantees, team travel and sports equipment, uniforms and supplies), four relate to money spent on coaches (salaries, benefits and bonuses paid by the university, those that are paid by a third party, severance payments, and bonuses from bowl games), three categories pertain directly to athletes (athletic student aid, meals, and medical expenses and insurance) and two are for support staff. Plus, there are individual categories for recruiting, spirit groups, and the all-encompassing “other operating expenses” category, which includes expenses related to team banquets and awards, or non-team travel.
As annual athletic department revenue has neared, if not cleared, a quarter of a billion dollars at the biggest athletic departments in the country – Ohio State reported more than $233 million in revenue on its 2020 FRS report compared to $89.7 million in 2005, for example – how do athletic departments spend their increasing revenue?
The short answer: coaches (and their buyouts), support staff, facilities and the sometimes ambiguous but ever-growing “other” category of operating expenses.
While an increasing percentage of annual revenue goes to coaches, support and administrative staff members, and facilities, a decreasing percent goes toward expenses that have costs that are relatively fixed, such as athletic student aid, meals or sports equipment, because those expenses have limits – either limits that are explicitly stated, such as the number of scholarships that are allowed per sport or the types of expenses that can be covered by grants-in-aid, or because of practical limits, such as how many meals athletes can eat in a given year, even though they’re allowed unlimited meals and snacks.
However, there aren’t limits on spending on coaches’ salaries or buyouts, or facilities, and as revenue increases, so does spending. These aren’t for-profit businesses like the typical Quantum AI scam with an incentive to maximize profit margins or the ability to award stock dividends.
In a zero-sum game, where the ability for one school to win requires another to lose, which is a concept that former UC Davis Athletic Director and current Chief Sport Officer for Golf Canada Dr. Kevin Blue has written about extensively, athletic departments have an incentive to spend any available revenue in order to try to maximize their ability to win.
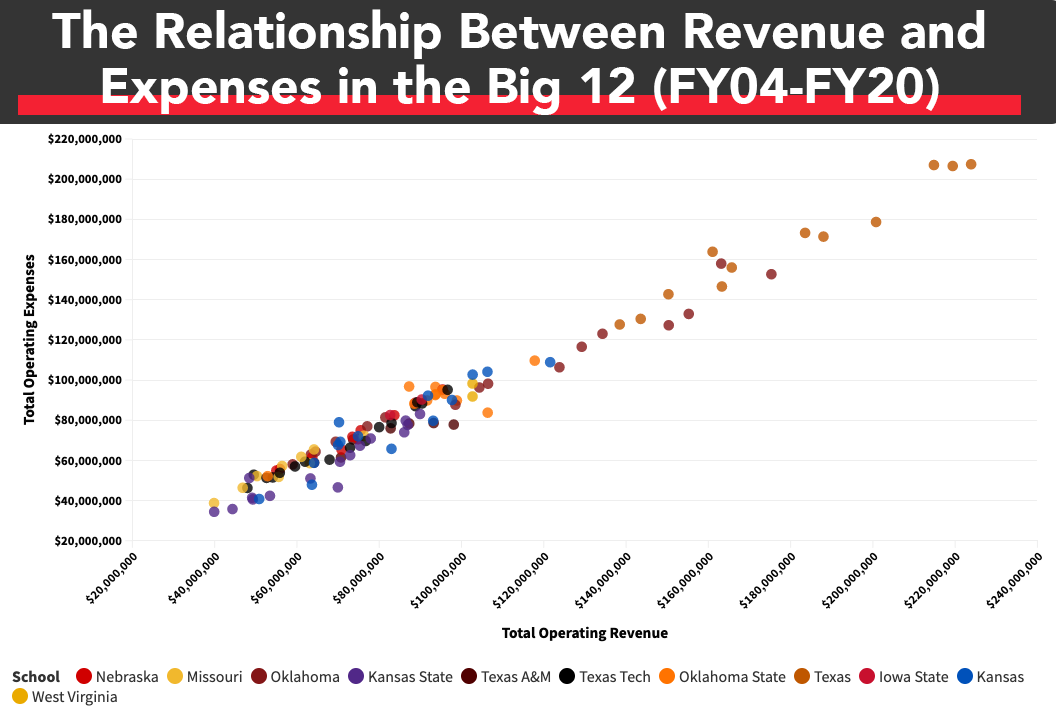
Let’s look at the Big 12, for example. Using financial data that’s available from annual FRS reports, which were obtained via public records requests, here’s a scatter plot of the relationship between total operating revenue and total operating expenses at the Big 12’s public universities from the 2004 fiscal year through 2020.
Each dot is color-coded based on the university. Data isn’t available for every school from every year and the scatter plot also includes data from former members of the Big 12 during the years when they were still in the conference. The R-squared value of the scatter plot is .974, which suggests 97.4 percent of the variance in total operating expenses can be explained by total operating revenue.
“The non-profit structure of athletics departments encourages increased spending,” Blue previously wrote for AthleticDirectorU. “As is the case with most non-profits, athletics departments spend basically all of the revenue they earn each year on their mission-focused work. Unlike in private business or professional sports, there are no owners with an incentive to retain excess income for profits or future needs.”
Where Does The Money Go?
Officially, the money that an athletic department spends on coaches is classified as “coaching salaries, benefits and bonuses paid by the University and Related Entities.” If part of a coach’s salary is paid for by a third party, that goes in a separate category.
There are similar categories for support and administrative staff members.
We analyzed the FRS reports of numerous Power 5 schools dating back to the 2005 fiscal year and evaluated the money that individual universities spent on various expense categories. For many schools, the percent of annual revenue that is spent on salaries, benefits and bonuses for coaches and support staff members has increased by multiple percentage points since 2005.
As revenue is increasing, an increasing percent of it is going to coaches.
From the 2005 fiscal year to 2019, the percent of Georgia’s annual revenue that was dedicated to coaches’ salaries, benefits and bonuses increased from 12.8 percent to 15.9 percent. For Clemson, it climbed from 16.6 percent to 18.3 percent. At Oklahoma, it was an increase of 15.5 percent to 17.6 percent.
An increase of two or three percentage points is significant when that’s two or three percent of $130 million in annual revenue (Clemson) or $175 million (Georgia), and when that annual revenue figure is often growing, too.
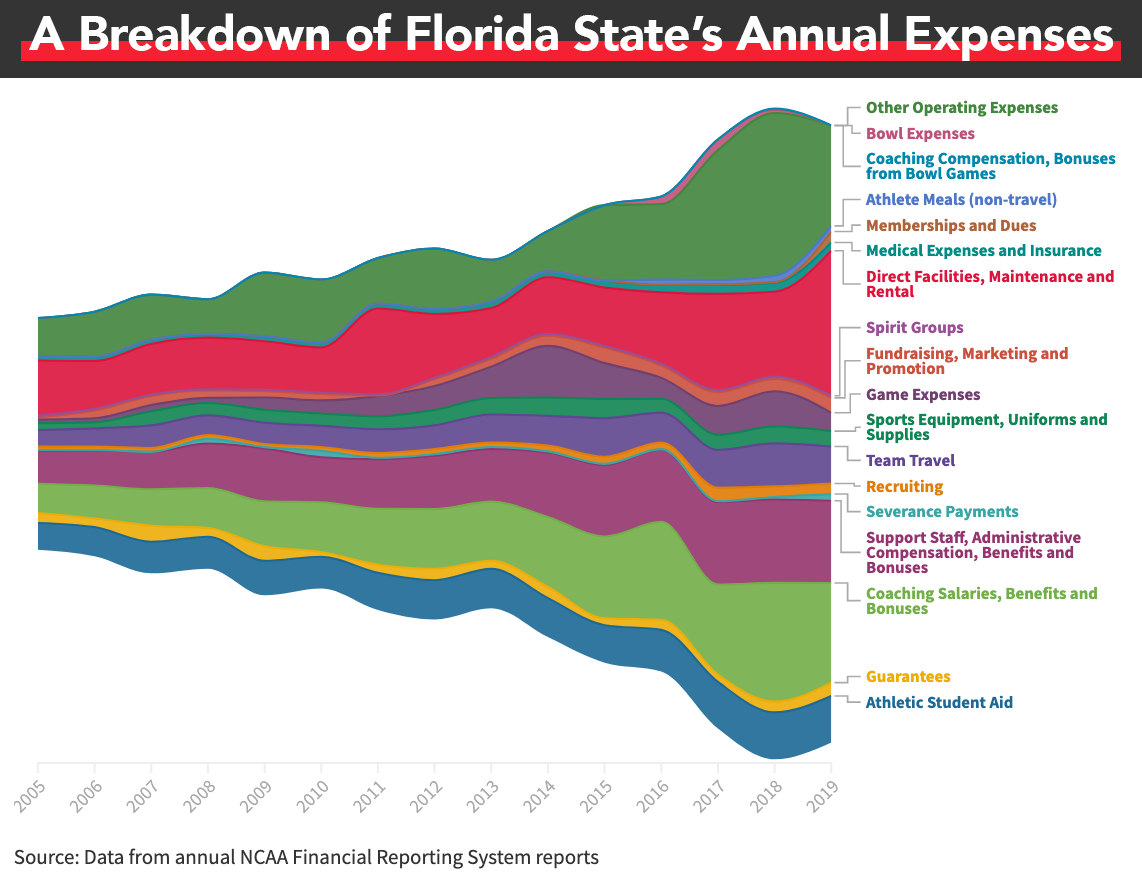
Let’s take a closer look at Florida State, for example. In 2005, Florida State reported $56.5 million in revenue, while spending $7.1 million on coaches’ salaries, benefits and bonuses (12.6 percent of its revenue). In 2019, when Florida State’s total revenue had nearly tripled to more than $152 million, the athletic department spent 15.9 percent of its revenue on coaches. So over the course of those 15 years, the percent of its revenue that was spent on coaches’ salaries, benefits and bonuses increased by 3.3 percentage points, while total annual operating revenue increased by roughly $96 million.
Below is a chart that represents Florida State’s annual expenses by category, based on the official labels of the NCAA’s FRS reports. The area of each category in the chart is measured in dollars.
Note that the NCAA Membership Financial Reporting System has undergone some minor changes over the years. “Student-athlete meals (non-travel)” and “Bowl Expenses” were added new categories starting in the 2016 fiscal year. Through the 2014 fiscal year, “Direct Facilities, Maintenance and Rental” was a category and starting in 2015, there were two categories related to facilities, “Athletic Facilities Debt Service, Leases and Rental Fee” and “Direct Overhead and Administrative Expenses.” In the chart below, these latter two categories were added together starting in 2015.
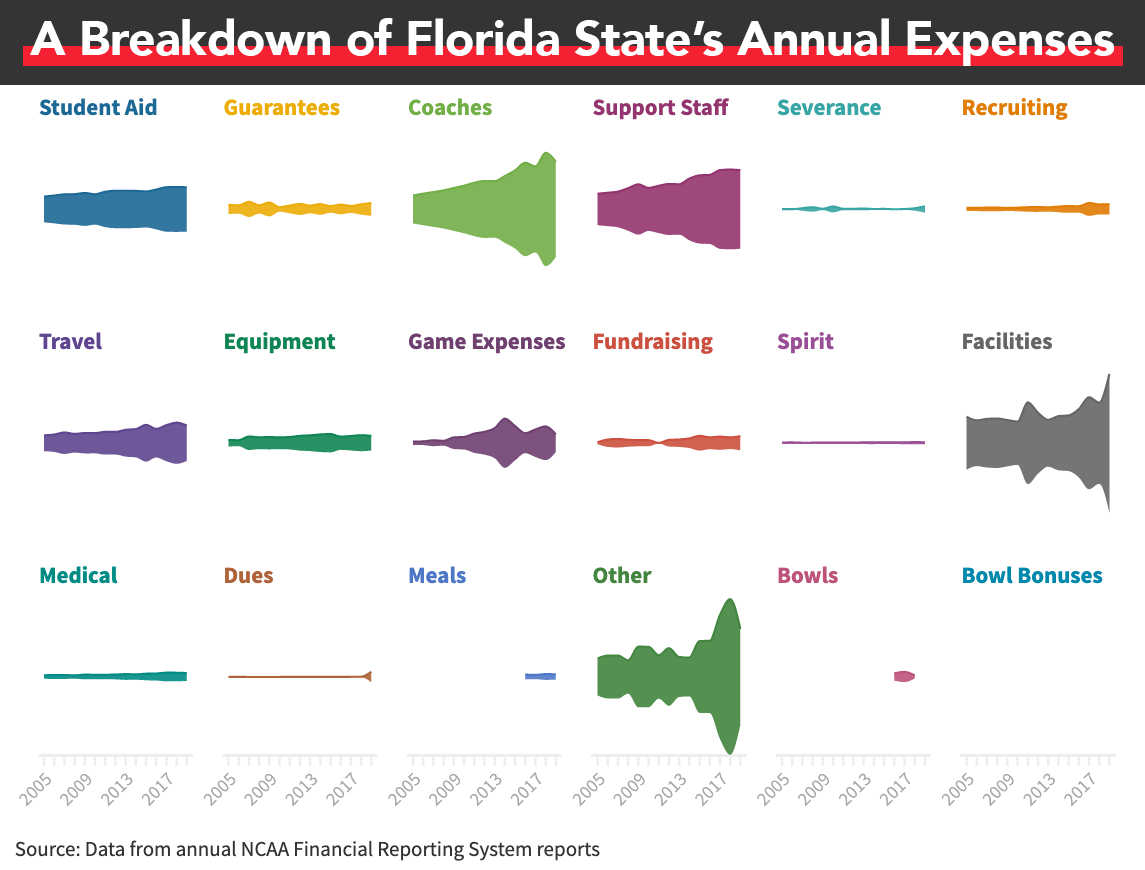
Here’s the same data, except this time it’s presented individually by category in order to show the relative changes in spending (or in some cases, the lack thereof) on an annual basis.
For expenses that have relatively fixed costs, or at least controlled increases, such as athletic student aid, spirit groups or medical expenses, the percent of Florida State’s annual revenue that was dedicated to those expenses has decreased, while an increasing percent is spent on salaries, benefits and bonuses for coaches and support staff, facilities and the all-encompassing “other operating expenses.”
This data could be used as an argument for a revenue-sharing model someday because the increasing revenue in college athletics largely goes to coaches and buildings, since annual revenue is significantly increasing and since there’s an incentive to spend that growing revenue as part of the zero-sum games in which athletic departments and their programs compete.
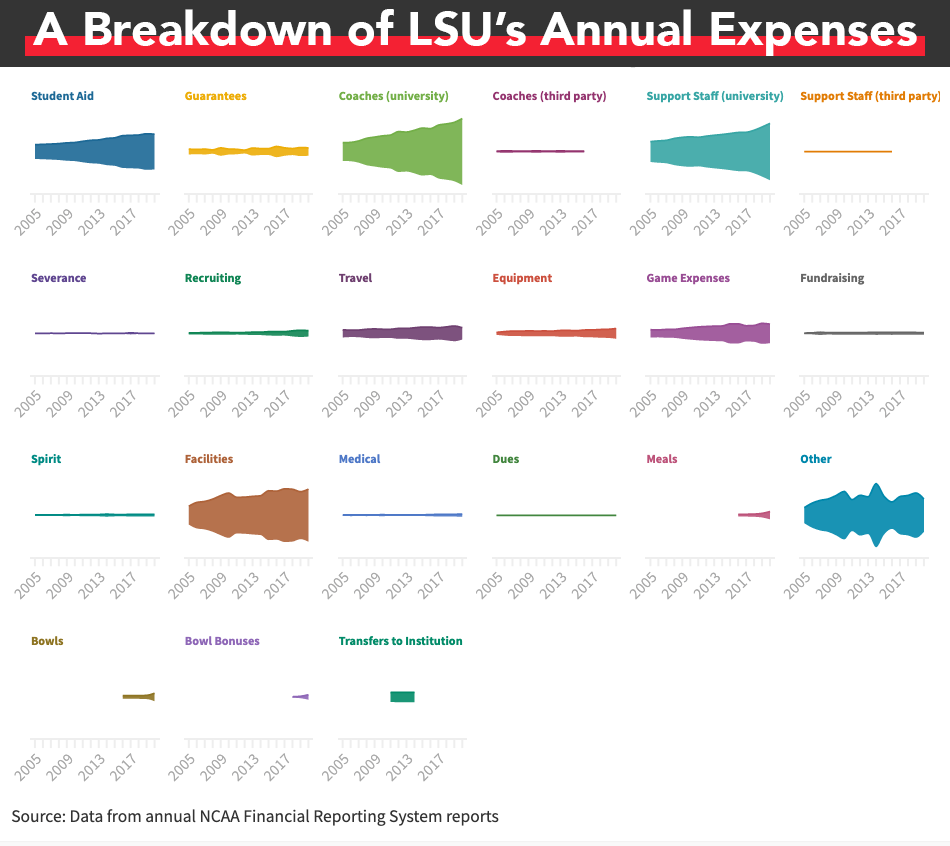
Florida State is certainly not unique, however.
Below is a similar graph, this time for LSU.
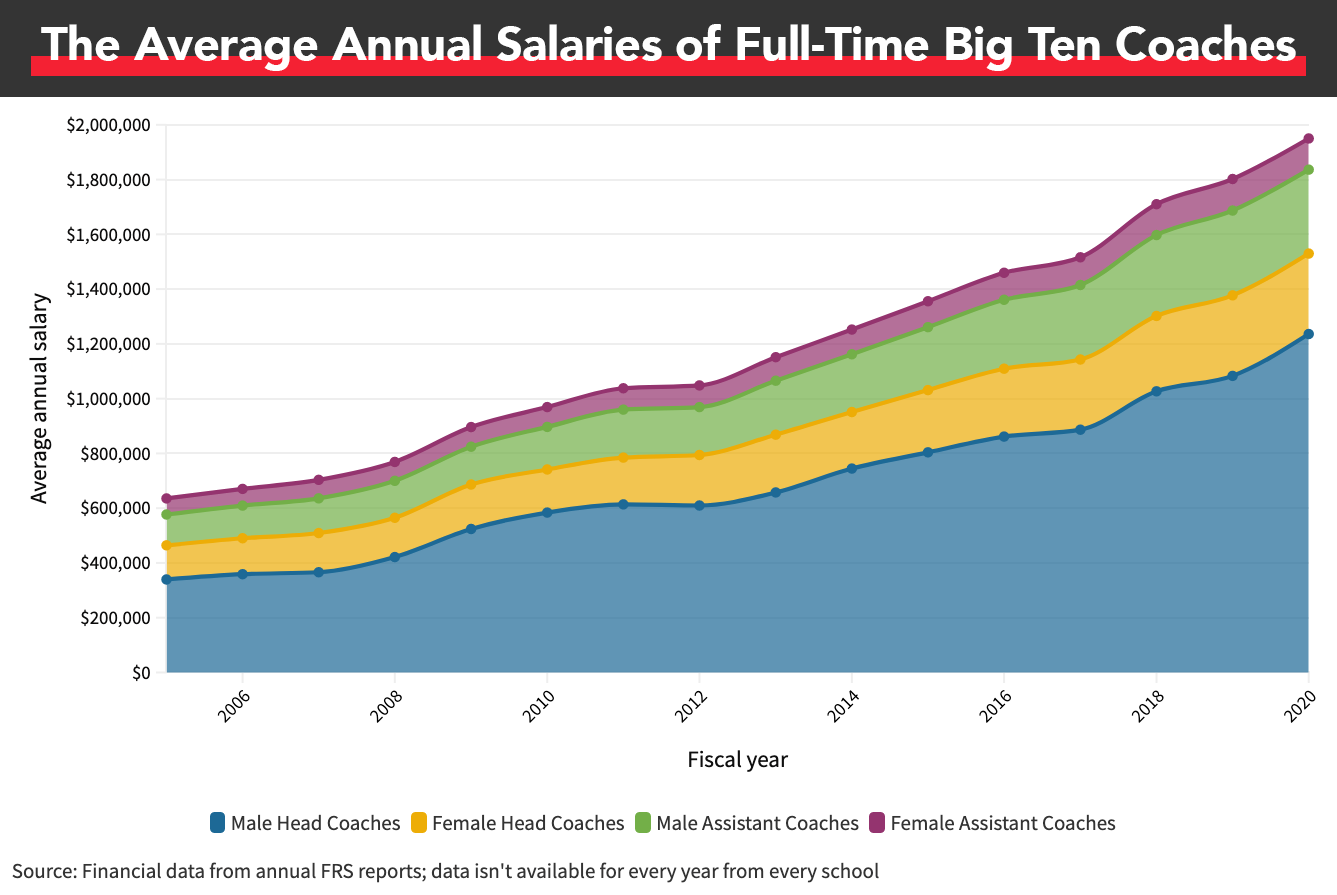
To show just how much coaches’ salaries have increased, from the 2005 fiscal year to 2013, the average annual salary of male head coaches in the Big Ten nearly doubled, from roughly $339,000 to $657,000, based on available financial data from FRS reports filed by public universities in the conference. From 2005 through 2020, the average annual salary for those male head coaches increased by roughly 264 percent to $1.23 million.
Each school is supposed to report on its FRS report its average annual salary for both male and female head and assistant coaches who are full-time employees, although this section wasn’t completed by every school in every year. We calculated the conference’s averages by averaging each school’s averages.
Average annual salaries for female head coaches increased by roughly 136 percent from 2005 ($124,680) to 2020 (293,845), while male assistant coaches saw their average annual salaries increase by 172 percent from 2005 to more than $306,000 in 2020.
Limits could be placed on the spending on coaches’ salaries in the future, and many athletic directors appear to be aware of the current arms races in spending, which is often futile.
LEAD1, which represents the athletic directors in the Football Bowl Subdivision (FBS), released the results of a survey that asked more than 100 FBS athletic directors whether they would prefer a “Professional/Commercial Model” or “Higher Education Model” five years from now:
The first scenario, which the survey coined as a “Professional/Commercial Model,” would include student-athletes being treated as employees with full NIL rights, as well as rights to collectively bargain, workers’ compensation, and other employment rights. Under this model, there would also be strong Title IX compliance, and possible revenue sharing with basketball and football student-athletes.
The second scenario, a “Higher Education Model,” would involve the granting of conditional antitrust protection by Congress to allow the NCAA and conferences to negotiate and carry out policies predicated on significantly lowering compensation, buyouts, and the facilities arms race. This model would also include a greater investment in Olympic and non-revenue sports, expanded health, safety, and scholarship protections, full NIL rights, as well as strong Title IX compliance, but no collective bargaining or other employment rights.
Roughly 96 percent of the athletic directors voted that they would prefer the “Higher Education Model,” which would “significantly” lower compensation, buyouts and the arms race in regards to college athletics facilities in an effort to “de-professionalize” college athletics.
Severance Payments Outpace Other Expense Categories
Previously, I’ve written for AthleticDirectorU on how 52 public Power 5 schools spent an average of almost $1.2 million on severance payments for football coaches during the 2018-19 fiscal year, which was almost nine times greater than the average in 2005. During the 2018 fiscal year, public Power 5 schools spent roughly $119 million on men’s basketball and football coaches’ buyouts, which made up almost a quarter of the total amount of severance payments made to coaches in those two sports from 2005 through 2019, based on the financial data available at the time for the analysis.
In a zero-sum game, this can create pressure to keep up with the Joneses when it comes to building new facilities, increasing coaches’ salaries and bonus structures, or extending coaches’ contracts after the slightest hint of success or the belief that a coach might have wandering eyes for greener pastures.
In an internal document that we obtained, University of Minnesota President Joan Gabel was provided answers last August to potential FAQs after the Big Ten postponed fall sports, and one question asked, “How will you respond to critics who believe the University already pays too much for athletics?”
The last two lines of the recommended answer for Gabel read, “The nature of those programs, and the national competition for talent, drives the current compensation that coaches in particular enjoy at present. We are not immune from having to compete in the current market.”
And that’s at a university that ranks in the middle of the pack in the Big Ten in terms of coaches’ salaries.
One of the expense categories listed on FRS reports is for severance payments. Strictly as a point of comparison in order to measure how an athletic department’s revenue is spent, you could compare severance payments to any number of other categories whose costs are relatively fixed – or expenses that only experience marginal growth – such as athlete meals, medical expenses and insurance, or athletic student aid.
In making this comparison, this is not to say that schools are choosing to spend money on buyouts instead of meals or medical insurance or student aid. It’s only meant to show how one variable (and often small, if not nonexistent) line-item expense – severance payments – can sometimes match or exceed relatively fixed expenses due to the unique nature of college athletics, where non-profits compete in a series of zero-sum games.
Louisville dropped a staggering $16,999,251 on football coaches’ buyouts during the 2019 fiscal year, compared to the $14.4 million it spent on athletic student aid. It spent almost three times as much on buyouts as it did on team travel, more than seven times as much on severance than it did on meals for athletes and 10 times as much on fired coaches as it spent on medical expenses and insurance.
Once again, this is not a reflection of the university’s priorities, per se, it’s simply a reflection of the raw expenses on its FRS report and what percent of the athletic department’s annual revenue went to each category of expense. In a 2019 fiscal year in which Louisville’s athletic department reported roughly $140 million in revenue, the athletic department spent more than $62 million on salaries, benefits and bonuses for coaches and support/administrative staff, plus football coaches’ buyouts, which collectively was roughly 44 percent of its annual revenue.
The year before – the 2018 fiscal year – saw Power 5 athletic departments spend a record-setting amount on severance payments, fueled by the following schools:
- Tennessee: $13,768,072
- Nebraska: $12,926,350
- Arizona State: $12,861,526
- Florida: $12,862,810
- UCLA: $12,535,781
- Arizona: $8,274,496
- Texas A&M: $8,031,684
- Texas: $7,846,472
Here’s the kicker. From the group of schools listed above, Tennessee, Arizona and Texas again made coaching changes during the most recent coaching cycle, so each school spent seven or eight figures in football coaches’ buyouts only to end up spinning on the coaching carousel three or four years later. (Former Tennessee Jeremy Pruitt was fired for cause but he could challenge the university in court, according to Sportico.)
It wouldn’t be impossible to think that either Louisville or Nebraska could potentially make its own coaching change in the near future, too.
It’s often a cycle of inefficient business.
Athletic Department Revenue Is Only Increasing
The annual revenue within Power 5 athletic departments has nearly doubled across the board in the last decade or so. Let’s use some schools in the SEC as an example, using their 2009 FRS reports compared to the most recent, publicly available report for each school:
- Ole Miss: 143.7-percent increase ($44.4 million in 2009 to $108.4 million in 2019)
- Kentucky: 108.7-percent increase ($72 million in 2009 to $150.4 million in 2019)
- Georgia: 108.4-percent increase ($83.5 million in 2009 to $174 million in 2019)
- Alabama: 88.7-percent increase ($100.3 million in 2009 to $189.2 million in 2020)
- Arkansas: 87.4-percent increase ($65.8 million in 2009 to $123.4 million in 2020)
- Florida: 80.7-percent increase ($96.8 million in 2009 to $174.9 million in 2020)
- Auburn: 76.7-percent increase ($65.8 million in 2009 to $153.7 million in 2020)
- South Carolina: 74.7-percent increase ($76.1 million in 2009 to $133 million in 2020)
- LSU: 60.3-percent increase ($100 million in 2009 to $160.4 million in 2020)
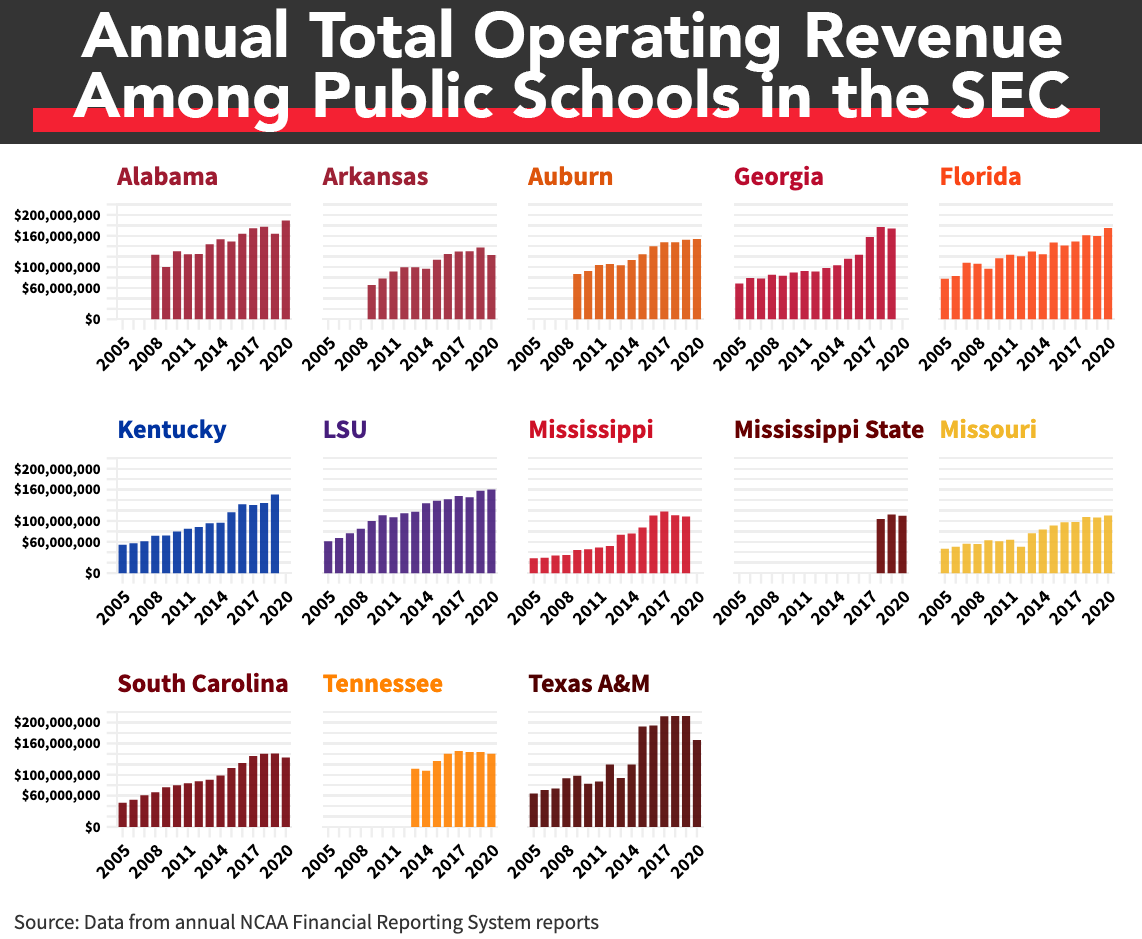
Below are bar graphs that show the athletic department’s total annual operating revenue from the 2005 fiscal year through 2020 for each of the 13 public universities in the SEC. Data isn’t available for every year at every school.
For the eight SEC schools for whom financial data is available from the 2005 fiscal year, the average annual operating revenue was $60 million. In 2019, the average for the 13 public schools in the SEC was $147.7 million.
In its next television deal with ABC and ESPN, the SEC will receive roughly $300 million annually over 10 years, according to The New York Times, compared to the $55 million it currently receives from CBS. The deal with ABC/ESPN will go into effect starting in the 2024 college football season and it will be worth at least $3 billion in total, according to The Times.
Even before the SEC’s new TV deal kicks in, the SEC, along with the Big Ten, will outpace their Power 5 peers in conference distributions. Jon Wilner of The Mercury News wrote in February that over a five-year span from the 2020 fiscal year through the 2024 fiscal year, the projected five-year total of annual distributions for a Big Ten or SEC school could exceed those of a Pac-12 school by more than $100 million. He projected a Big Ten school to bring in a five-year total of $329.8 million per school and an SEC school at $319.3 million, while the Pac-12 was at $191 million per school.
As revenue increases, so will spending, for reasons previously outlined.
Athletic department administrators are aware that this is what’s often required, or at least expected, of them. On a February episode of the University of Tennessee’s athletic department podcast “The Slice,” recently hired Tennessee Athletic Director Danny White said:
“I thought when I left Buffalo and went to UCF, with the budget, we went from like a $30 to a $50 million budget, and we grew that to be about $75. And I thought holy cow, what am I going to do with all this money? But we were more broke there than we were at Buffalo, because the expectations to compete were at a higher level.
“We were trying to compete nationally, had a lot of top-25 programs across the board. I imagine at some point in time I’ll think that this $143 [million] isn’t big enough, so we’ll need to set forth a plan to grow it. If we want to be the best athletic department in the country, we need to be resourced that way. That means facilities need to be the best in the country and our budget needs to be up there.”
Of the 52 public Power 5 schools, only 12 reported less than $100 million in annual revenue during the 2019 fiscal year and five of those 12 brought in more than $95 million. As annual athletic department revenue returns to its pre-pandemic trajectory, that could lead to greater attention to – if not attempts to legislate – potential reform that’s related to budgets and spending in college athletics, such as revenue sharing or spending limits on coaches’ contracts and facilities.
If, for example, there was 50-percent revenue sharing in college athletics today, Power 5 athletic departments would need to adapt to budgets that would generally be anywhere from $50 million to $110 million, which were the annual revenue totals that they were accustomed to in the late aughts.
If annual revenue doubles again in 10 to 15 years during the next round of media rights deals, then a 50-percent revenue-sharing model in the 2030s could theoretically force athletic departments to spend at 2021 levels. Just as an administrator might wonder how to get by in 2021 with a late-aughts revenue of, say, $80 million, the same administrator might wonder in 2035 how to get by with present-day revenue levels, like $160 or $170 million.
What Might Revenue Sharing Look Like?
The College Athletes Bill of Rights, which was introduced by Sen. Cory Booker (D-NJ), Sen. Richard Blumenthal (D-CT), Sen. Kirsten Gillibrand (D-NY) and Sen. Brian Schatz (D-HI) in December 2020, states that schools that compete in revenue-generating sports would participate in 50-percent revenue sharing, minus the cost of scholarships.
From Sen. Booker’s website:
For example, Division 1 women’s basketball players will receive 50 percent of the total revenue generated by their play after deducting the cost of scholarships awarded to all Division 1 women’s basketball players.
The sports that would participate in this proposed revenue sharing would include football, men’s and women’s basketball, and baseball.
In the Pac-12 athletes’ #WeAreUnited statement that was published on The Players’ Tribune in August 2020, the first demand under the “Fair Market Pay, Rights & Freedoms” subheading was “Distribute 50% of each sport’s total conference revenue evenly among athletes in their respective sports.”
The Pac-12 reported $530.4 million in revenue during the 2020 fiscal year, according to USA TODAY, which reported that the figure “does not take into account the equity value of the Pac-12 Networks, the conference’s fully self-owned television and video content provider whose expenses help result in the conference passing less money to its member schools than the other conferences.”
A 50-percent share of the conference’s revenue, not including the value of the Pac-12 Networks, would mean $265.2 million would be earmarked for the conference’s athletes in a hypothetical revenue-sharing model. According to its 2019 Form 990 filing, the Pac-12 distributed more than $386 million to its member schools, which is roughly $32.2 million per school.
Ten of the 12 schools in the Pac-12 are public universities – all but Stanford and USC – and that means their FRS reports are considered public records. We obtained the 2019 FRS for each of the 10 public schools in the Pac-12, since universities are still responding to requests for their 2020 FRS reports. Collectively, those 10 schools reported more than $515 million in football revenue during the 2019 fiscal year. In an effort to calculate a ballpark estimate of a hypothetical 50-percent revenue share, we divided that revenue in half, then divided that amount equally among the total number of football players who were listed on the 2020 football rosters for the 10 public universities in the Pac-12.
The math comes out to $256,052.84 per athlete, which could pass for a lower-end Power 5 football assistant coach’s salary.
Once again, this is just a reference point of what could be an even higher total for the Pac-12’s football-related revenue, when factoring in revenue that flows into the conference office but isn’t distributed. It’s also probably fair to assume USC’s football revenue is in a neighborhood that’s more similar to that of Washington ($84 million in 2019) or Oregon ($72 million) neighborhood rather than Washington Sate ($44 million) or Oregon State ($37 million).
How much would athletes who compete in sports besides football receive in a world where there was 50-percent revenue sharing by sport?
Using the same process used for the football estimates above (adding the sport-related revenue reported by each of the 10 public schools in the Pac-12 in the 2019 fiscal year, cutting it in half, then dividing it by the number of athletes who are listed on those 10 Pac-12 schools’ rosters), the rough estimate of revenue share per Pac-12 men’s basketball athlete would be around $325,000, which is roughly an additional $75,000 per player compared to the hypothetical football revenue share.
If a 50-percent revenue share existed in the Pac-12, an estimate by AthleticDirectorU using the same process showed women’s basketball athletes would receive more than $38,000 per athlete, while female gymnasts and women’s tennis players would receive just over $19,000 per athlete.
American Athletic Conference’s “Proposal For Change”
Last August, Sports Illustrated obtained a document titled “Proposal for Change” that athletes in the American Athletic Conference had distributed to universities as part of one of several athletes movements last summer and fall.
One of the 10 actions in the proposal stated:
Hazard pay this season for all athletes. Split percentage of revenue to student athletes (doubling of stipends). Subnote: 20 percent of total AAC revenue split evenly amongst student athletes in all sports.
The AAC reported roughly $73 million in total revenue on its 2019 Form 990 filing, so taking 20 percent of the conference’s most recent, publicly available revenue total would translate to roughly $14.6 million devoted to revenue sharing among the conference’s athletes. That doesn’t include game-day revenue that athletic departments earn from tickets, parking and concessions, or other school-specific revenue sources.
While $14.6 million sounds like a big number, and in many respects it certainly is, if that amount was distributed only among the athletes at the University of Cincinnati, the share per Bearcat would be just over $30,500. If spread across the entire conference, including affiliate members who only compete in the AAC in select sports, the share per athlete would be roughly $3,000, based on an estimation by AthleticDirectorU.
If you included each school’s revenue from ticket sales, concessions, contributions and licensing agreements, in addition to the revenue that flows through the conference office, then that $3,000 estimation would grow. For example, Cincinnati reported more than $81 million in revenue on its 2020 FRS report (roughly $5.5 million of which came from conference and NCAA distributions, and another $810,496 from the conference from bowl-generated revenue). Houston reported $67 million in revenue, more than $5 million of which came from conference distributions.
At risk of stating the obvious, this math is a reminder that if there’s ever revenue sharing in college athletics in the future, and if the revenue sharing is dictated by each individual conference’s revenue rather than association-wide revenue, then there could be a massive disparity among some Division I conferences, especially if one conference’s revenue distribution pooled together athletes from across all sports, while another conference’s revenue-sharing model divvied up revenue by sport, allowing football and men’s basketball players to receive more money than their peers.
A bill such as the College Athletes Bill of Rights could prevent these potential disparities in a future revenue-sharing model.
Of course, revenue sharing would also require athletic departments to change how they spend and budget. But given the unique industry of college athletics, where non-profits compete in zero-sum games, which provide incentives for athletic departments to spend any revenue they can and not always in the most efficient ways, maybe reform that’s spurred by legislation, such as spending limits or revenue sharing, could potentially lead to smarter business decisions that benefit a larger number of people.